Review
. 2017 May 30;135(22):2178-2195.
doi: 10.1161/CIRCULATIONAHA.116.021978.

Magnetic Resonance Imaging of Cardiovascular Function and the Brain: Is Dementia a Cardiovascular-Driven Disease?

Affiliations
Review

Magnetic Resonance Imaging of Cardiovascular Function and the Brain: Is Dementia a Cardiovascular-Driven Disease?

Albert de Roos et al. Circulation. .

Abstract

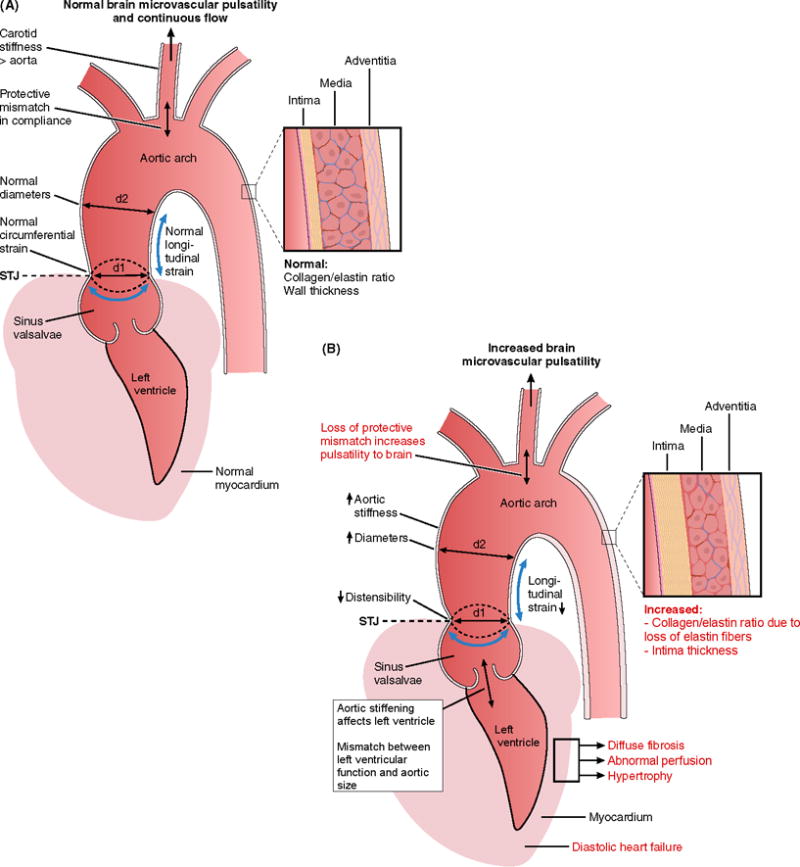
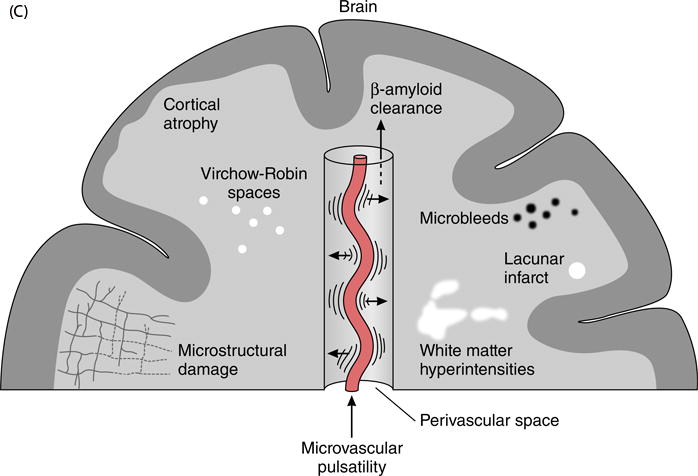
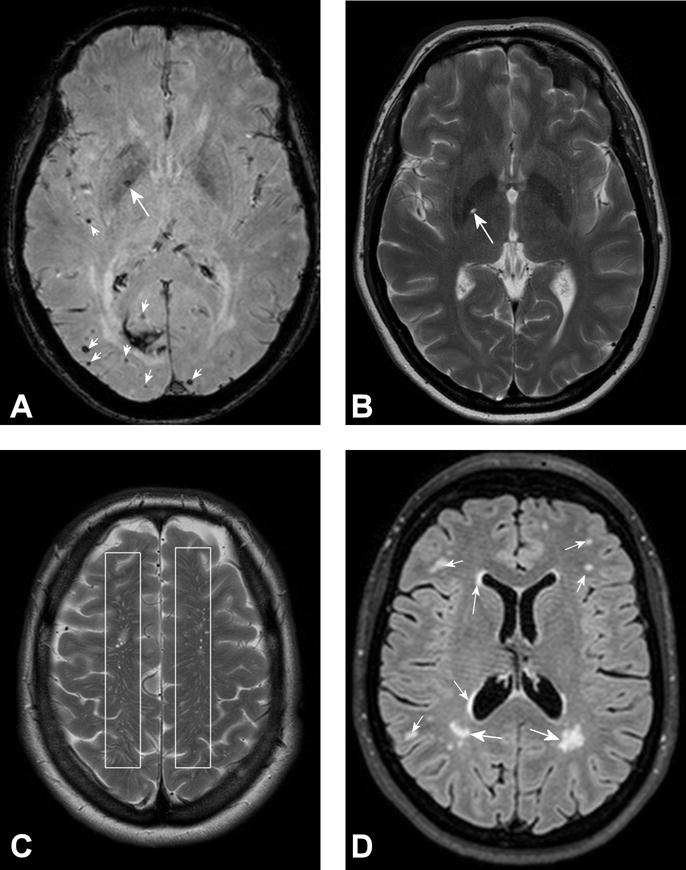
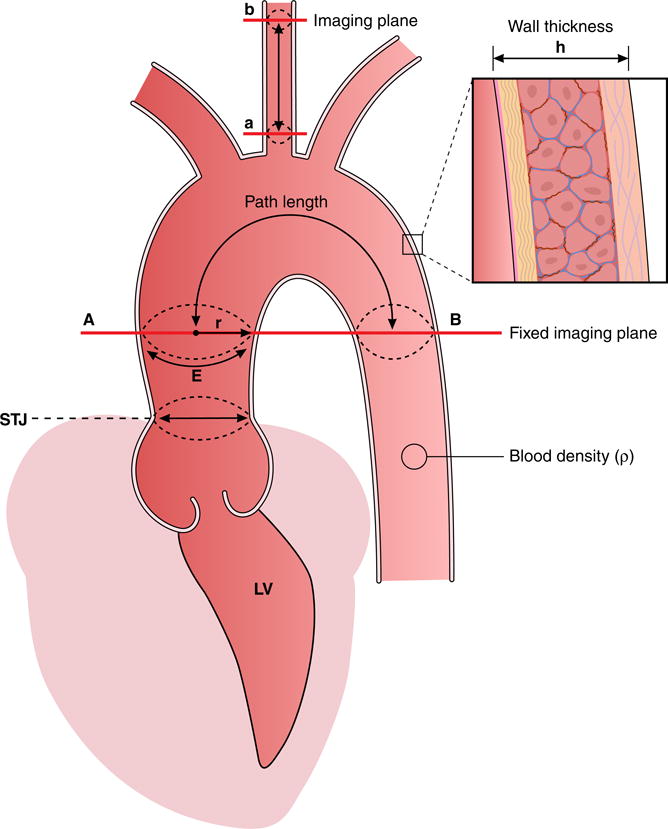
The proximal aorta acts as a coupling device between heart and brain perfusion, modulating the amount of pressure and flow pulsatility transmitted into the cerebral microcirculation. Stiffening of the proximal aorta is strongly associated with age and hypertension. The detrimental effects of aortic stiffening may result in brain damage as well as heart failure. The resulting cerebral small vessel disease and heart failure may contribute to early cognitive decline and (vascular) dementia. This pathophysiological sequence of events underscores the role of cardiovascular disease as a contributory mechanism in causing cognitive decline and dementia and potentially may provide a starting point for prevention and treatment. Magnetic resonance imaging is well suited to assess the function of the proximal aorta and the left ventricle (eg, aortic arch pulse wave velocity and distensibility) as well as the various early and late manifestations of cerebral small vessel disease (eg, microbleeds and white matter hyperintensities in strategically important regions of the brain). Specialized magnetic resonance imaging techniques are explored for diagnosing preclinical changes in white matter integrity or brain microvascular pulsatility.

Keywords: aorta; brain; cardiovascular disease; magnetic resonance imaging; pulse wave velocity.


Figures

Figure 1
Figure 1. A, B and C. The aging cardiovascular system interacting with brain pulsatility and perfusion
Relationship between proximal aortic stiffness, left ventricular function and brain microvascular pulsatility across the spectrum of age from young (<20 years, Panel A) to older (>70 years, Panel B). The pathophysiological changes with aging contribute to increasing microvascular brain pulsatility that may promote a spectrum of microstructural and macroscopic brain disease processes (Panel C) often associated with cognitive decline and dementia. The aortic wall may thicken and stiffen due to various processes with aging, including intimal thickening, elastin loss in the media, increased collagen deposition, cellular hyperplasia and fiber cross linking. Furthermore, aortic root mobility may decrease with aging and may be characterized by three-dimensional strain as illustrated at the sinotubular junction (STJ) in axial (d1), circumferential and longitudinal components. Note normal flaring out of proximal aorta (d1
Figure 2
Figure 2. A–D. Common brain MRI manifestations of small vessel disease
A. Microbleeds visualized as dark foci due to haemorrhage on susceptibility T2* MRI. Microbleed in basal ganglia (large white arrow in A) and number of microbleeds in parenchyma (small white arrows in A). B. Lacunar infarct is seen as bright spot in basal ganglia on T2-weigthed MRI scan (CSF is bright). C. Multiple enlarged Virchow-Robin spaces seen as small bright dots and linear structures (between boxes in C) on T2-weigthed MRI scan (CSF is bright). D. White matter hyperintensities throughout the brain and in periventricular location visualized as irregular shaped bright areas (arrows in D) on FLAIR MRI scan (CSF is dark).
Figure 3
Figure 3. Distensibility and Pulse Wave Velocity (PWV) in proximal aorta and carotid vessels estimated by MRI
The luminal area change or diameter change of the aorta at the STJ determines local distensibility, according to the formula: Distensibility = (Amax − Amin)/(Amin × PP) (in mmHg−1), where PP is central pulse pressure and Amax and Amin the maximal and minimal cross-sectional area, respectively. A fixed MRI imaging plane at the level of the ascending aorta (A) and transecting also the proximal descending aorta (B) is used to estimate aortic arch PWV. The path length Δx (in meters) between level A and B is divided by the difference in arrival time Δt (in seconds) between flow curves measured by velocity-encoded MRI at level A and B simultaneously to calculate PWV (expressed in meters/second). Vascular pulse wave velocity is determined by: 1. E (circumferential Young’s modulus, representing material rigidity); 2. h (vessel wall thickness); 3. r (luminal aortic radius); 4. rho ρ (blood density). The relation between these parameters is represented in the Moens-Korteweg equation, according to the formula: PWV = √(E×h / 2r×ρ). PWV and distensibility are inversely related to one another as defined by the Bramwell-Hill equation: PWV = √(1/(ρ×Distensibility)). These factors interact with LV function (e.g. increased cardiac output in obesity) resulting in a stiffer proximal aorta (PWV>) as a consequence of more collagen and less elastin in aortic wall (E>), increased wall thickness (h>), and/or change in aortic radius (> decreases PWV, < increases PWV). When aortic diameter is relatively small as compared to LV function with increased aortic flow and cardiac output, aortic flow and increased aortic stiffness cause increased forward pressure wave amplitude, subsequently resulting in increased pulse pressure and systolic hypertension. Similarly to aortic arch stiffness, carotid artery stiffness can be estimated from 2 imaging levels (a and b) using velocity-encoded MRI to measure the path length between a and b as well as the difference in arrival time between flow curves.
Figure 4
Figure 4. Assessment of pulse wave velocity over the ascending aorta and the aortic arch
A high-temporal velocity-encoded MRI acquisition plane is positioned perpendicular to the ascending aorta (A), transecting both ascending (in green) and descending aorta (in red). From through-plane velocity encoding, velocity mapping is performed after segmentation in anatomical (B) and velocity images (C). Velocity-time curves are determined (C) and the pulse wave velocity is calculated from the distance Δx between both measurement sites (determined along the centerline of the aorta, dashed line) and the transit time Δt of the onset of the systolic velocity wavefront, measured at each site: PWV = Δx/Δt (in m/s). In this example of a healthy 47 year male volunteer, Δx = 11.5 cm, Δt = 18 ms, resulting in a PWV of 6.4 m/s.
Figure 5
Figure 5. Assessment of pulse wave velocity of the left carotid artery
Two acquisition planes are positioned, one perpendicular to the common carotid artery just above the aortic arch (in green) and one perpendicular to the internal carotid artery just proximal to the petrous portion of the artery (in red). Velocity mapping is performed after segmentation in common carotid artery (B and C) and the internal carotid artery (D and E). Velocity-time curves are determined (F) and the pulse wave velocity is calculated from the distance Δx between both measurement sites (determined along the centerline of the vasculature) and the transit time Δt of the onset of the systolic velocity wavefront, measured at each site: PWV = Δx/Δt (in m/s). In this example of a healthy 47 year male volunteer, Δx = 19.6 cm, Δt = 25 ms, resulting in a PWV of 7.8 m/s.
Figure 6
Figure 6. Aortic root motion and expansion during the cardiac cycle
The sinotubular junction (STJ) and annulus show longitudinal strain from diastole to systole as compared to a relative stationary point at the level of the aortic arch (X=fixed point). A fixed imaging plane (as used in MRI) at the level of the STJ in diastole will intersect the ascending aorta more cranially to the STJ in systole due to longitudinal strain of the aortic root. The section of aorta that lies within the diastolic and systolic image planes is flaring out (d4>d1 in diastole and d5>d2 and d3>d2, respectively in systole), leading to overestimation of strain if through-plane motion is ignored. The fixed imaging plane would compute strain as (d3 - d1)/d1. The correct calculation should take (d2 - d1)/d1 and then adjust circumferential strain for longitudinal strain. A correction for longitudinal strain is not really relevant to PWV but is highly relevant to cross-sectional compliance. Most studies measure the aortic arch length in late diastole, when the aorta is relative static. The arch will get a bit longer in systole, but assuming there is 10% stretch of the ascending segment only (and possibly even a bit of compression of the descending segment since the root is being pulled downward), the error in transit distance will be small (less than half of 10%), so maybe a 5% error in resulting PWV. Furthermore, the foot of the aortic flow wave (used in the transit time method) propagates effectively at diastolic pressure, therefore the diastolic length of the arch is used to compute PWV. On the other hand, if raw circumferential strain is 5% and there is 10% longitudinal strain in the ascending aorta, the true effective circumferential strain would be 5% + (10%/2) = 10%, meaning this results in 100% error.

References

    1. Satizabal CL, Beiser AS, Chouraki V, Chene G, Dufouil C, Seshadri S. Incidence of Dementia over Three Decades in the Framingham Heart Study. The New England journal of medicine. 2016;374:523–532. - PMC - PubMed
    1. Jones DS, Greene JA. Is Dementia in Decline? Historical Trends and Future Trajectories. The New England journal of medicine. 2016;374:507–509. - PubMed
    1. Angermann CE, Frey A, Ertl G. Cognition matters in cardiovascular disease and heart failure. European heart journal. 2012;33:1721–1723. - PubMed
    1. Flynn KE, Pina IL, Whellan DJ, Lin L, Blumenthal JA, Ellis SJ, Fine LJ, Howlett JG, Keteyian SJ, Kitzman DW, Kraus WE, Miller NH, Schulman KA, Spertus JA, O’Connor CM, Weinfurt KP, Investigators H-A Effects of exercise training on health status in patients with chronic heart failure: HF-ACTION randomized controlled trial. Jama. 2009;301:1451–1459. - PMC - PubMed
    1. Deshields TL, McDonough EM, Mannen RK, Miller LW. Psychological and cognitive status before and after heart transplantation. General hospital psychiatry. 1996;18:62S–69S. - PubMed

MeSH terms