. 2017 Apr;4(2):021105.
doi: 10.1117/1.NPh.4.2.021105. Epub 2017 May 24.

Image reconstruction of oxidized cerebral cytochrome C oxidase changes from broadband near-infrared spectroscopy data

Affiliations

Image reconstruction of oxidized cerebral cytochrome C oxidase changes from broadband near-infrared spectroscopy data

Sabrina Brigadoi et al. Neurophotonics. 2017 Apr.

Abstract

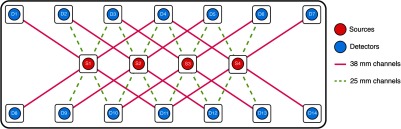
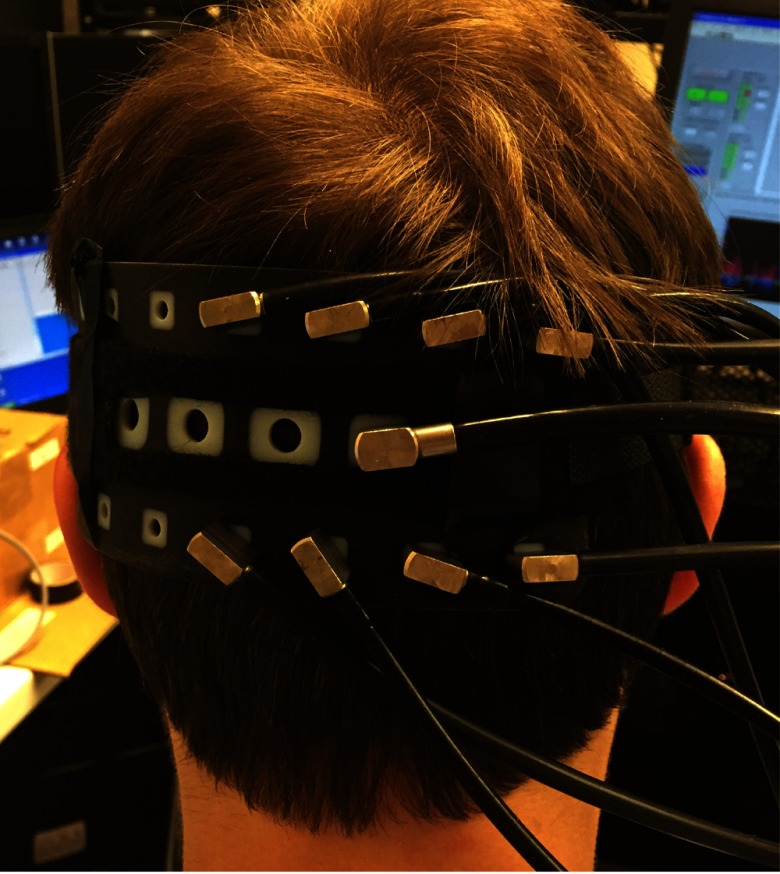
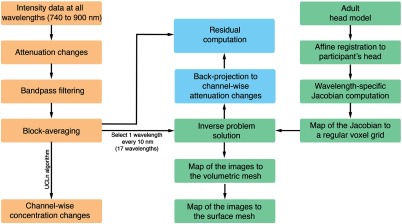
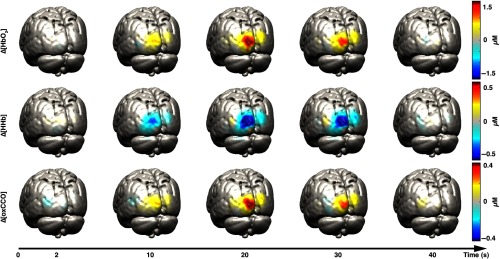
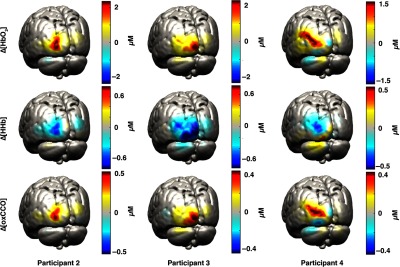
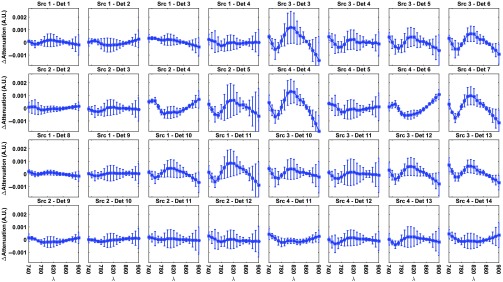
In diffuse optical tomography (DOT), overlapping and multidistance measurements are required to reconstruct depth-resolved images of oxy- ([Formula: see text]) and deoxy- (HHb) hemoglobin concentration changes occurring in the brain. These can be considered an indirect measure of brain activity, under the assumption of intact neurovascular coupling. Broadband systems also allow changes in the redox state of cytochrome c oxidase (oxCCO) to be measured, which can be an important biomarker when neurovascular coupling is impaired. We used DOT to reconstruct images of [Formula: see text], [Formula: see text], and [Formula: see text] from data acquired with a broadband system. Four healthy volunteers were measured while performing a visual stimulation task (4-Hz inverting checkerboard). The broadband system was configured to allow multidistance and overlapping measurements of the participants' visual cortex with 32 channels. A multispectral approach was employed to reconstruct changes in concentration of the three chromophores during the visual stimulation. A clear and focused activation was reconstructed in the left occipital cortex of all participants. The difference between the residuals of the three-chromophore model and of the two-chromophore model (recovering only [Formula: see text] and [Formula: see text]) exhibits a spectrum similar to that of oxCCO. These results form a basis for further studies aimed to further optimize image reconstruction of [Formula: see text].

Keywords: broadband; cytochrome C oxidase; functional near-infrared spectroscopy; image reconstruction; visual stimulation.


Figures

Fig. 1
Fig. 1
Array layout. Sources were positioned in the central row (red dots), while detectors were located in the bottom and top rows (blue dots). Eight channels per source could be recorded, for a total of 32 channels. Note that not all slots could be filled with a source or a detector during a single acquisition, since only one source and eight detectors were available at a time. Each acquisition was repeated four times, with the available source and detector fibers positioned in different slots for each acquisition so as to cover the entire imaging array over four acquisitions in each subject.
Fig. 2
Fig. 2
Optode holder placed on the left occipital cortex with one source (central row) and eight detectors.
Fig. 3
Fig. 3
Flow diagram summarizing the main steps of the data analysis and image reconstruction procedures.
Fig. 4
Fig. 4
Examples of reconstructed Δ[HbO2] (first row), Δ[HHb] (second row), and Δ[oxCCO] (third row) images on the GM surface mesh at five different time points for participant 1. The selected time points are 2, 10, 20, 30, and 40 s after stimulus presentation. Images were mapped to the MNI152 GM mesh for visualization purposes.
Fig. 5
Fig. 5
Examples of reconstructed Δ[HbO2] (first row), Δ[HHb] (second row), and Δ[oxCCO] (third row) images on the GM surface mesh for participant 2, 3, and 4. The reconstruction for 20-s poststimulus onset is displayed.
Fig. 6
Fig. 6
Grand-average hemodynamic responses in each channel to the functional activation task. Error bars represent the standard deviation across participants. Only the upper error bar for HbO2 and the lower error bar for HHb are reported for visualization purposes. Δ[HbO2] is reported in red, Δ[HHb] in blue, and Δ[oxCCO] in green. These responses were obtained using the data from the whole broadband spectrum (740 to 900 nm) and the UCLn algorithm.
Fig. 7
Fig. 7
Grand-average residual difference between the two- and three-chromophore model in each channel and for each wavelength at time point 20. Error bars represent the standard deviation across participants.

Similar articles

Cited by

References

    1. Jöbsis F. F., “Noninvasive, infrared monitoring of cerebral and myocardial oxygen sufficiency and circulatory parameters,” Science 198, 1264–1267 (1977).SCIEAS10.1126/science.929199 - DOI - PubMed
    1. Eggebrecht A. T., et al. , “Mapping distributed brain function and networks with diffuse optical tomography,” Nat. Photonics 8, 448–454 (2014).NPAHBY10.1038/nphoton.2014.107 - DOI - PMC - PubMed
    1. Arridge S. R., “Methods in diffuse optical imaging,” Philos. Trans. R. Soc. A 369, 4558–4576 (2011).10.1098/rsta.2011.0311 - DOI - PubMed
    1. Singh H., et al. , “Mapping cortical haemodynamics during neonatal seizures using diffuse optical tomography: a case study,” NeuroImage Clin. 5, 256–265 (2014).10.1016/j.nicl.2014.06.012 - DOI - PMC - PubMed
    1. Chalia M., et al. , “Hemodynamic response to burst-suppressed and discontinuous electroencephalography activity in infants with hypoxic ischemic encephalopathy,” Neurophotonics 3, 031408 (2016).10.1117/1.NPh.3.3.031408 - DOI - PMC - PubMed