

Isoform specific differences in phospholipase C beta 1 expression in the prefrontal cortex in schizophrenia and suicide
- PMID: 28560265
- PMCID: PMC5441535
- DOI: 10.1038/s41537-017-0020-x
Isoform specific differences in phospholipase C beta 1 expression in the prefrontal cortex in schizophrenia and suicide
Abstract
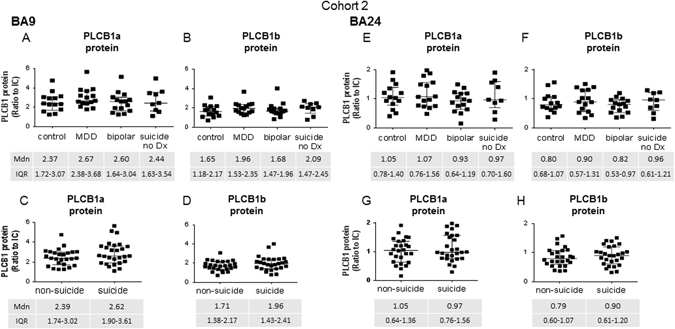
Our previous study demonstrated that phospholipase C beta 1 mRNA was down-regulated in Brodmann's area 46 from subjects with schizophrenia. However, phospholipase C beta 1 protein has also been shown to be lower in Brodmann's area 8 and 9 from teenage suicide subjects, creating a potential confound in interpreting the findings in schizophrenia due to the high suicide rate associated with this disorder. To begin to reconcile and consolidate these findings, in this study, we measured mRNA and protein levels of phospholipase C beta 1 variants a and b in Brodmann's area 46 and Brodmann's area 9 from subjects with schizophrenia, many of whom were suicide completers, and determined the diagnostic specificity of observed findings. Consistent with our previous study, levels of phospholipase C beta 1 a and b mRNA, but not protein, were lower in Brodmann's area 46 from subjects with schizophrenia. In Brodmann's area 9, phospholipase C beta 1a protein levels were lower in subjects with schizophrenia, while phospholipase C beta 1b mRNA was higher and protein was lower in those that had died of suicide. Altered protein levels in Brodmann's area 9 appeared to be diagnostically specific, as we did not detect these changes in subjects with bipolar disorder, major depressive disorder or suicide completers with no diagnosis of mental illness. We further assessed the relationship between phospholipase C beta 1 and levels of muscarinic receptors (CHRMs) that signal through this protein, in both human and Chrm knockout mouse central nervous system tissue, and found no strong relationship between the two. Understanding central nervous system differences in downstream effector pathways in schizophrenia may lead to improved treatment strategies and help to identify those at risk of suicide.
Conflict of interest statement
A/Prof Scarr received an honorarium from Astra-Zeneca and travel support from GSK. Prof Dean received travel support from GSK and honoraria from Pfizer, Eli Lilly and MSD. Prof Felder is an employee of Eli Lilly & Co. The other authors declare that they have no competing interests.
Figures


Similar articles
-
Low muscarinic receptor binding in prefrontal cortex from subjects with schizophrenia: a study of Brodmann's areas 8, 9, 10, and 46 and the effects of neuroleptic drug treatment.Am J Psychiatry. 2001 Jun;158(6):918-25. doi: 10.1176/appi.ajp.158.6.918. Am J Psychiatry. 2001. PMID: 11384900
-
Low phosphoinositide-specific phospholipase C activity and expression of phospholipase C beta1 protein in the prefrontal cortex of teenage suicide subjects.Am J Psychiatry. 1999 Dec;156(12):1895-901. doi: 10.1176/ajp.156.12.1895. Am J Psychiatry. 1999. PMID: 10588402
-
Comparative analysis of group II metabotropic glutamate receptor immunoreactivity in Brodmann's area 46 of the dorsolateral prefrontal cortex from patients with schizophrenia and normal subjects.Mol Psychiatry. 2002;7(2):157-64. doi: 10.1038/sj.mp.4000966. Mol Psychiatry. 2002. PMID: 11840308
-
fMRI study of language activation in schizophrenia, schizoaffective disorder and in individuals genetically at high risk.Schizophr Res. 2007 Nov;96(1-3):14-24. doi: 10.1016/j.schres.2007.07.013. Epub 2007 Aug 24. Schizophr Res. 2007. PMID: 17719745 Free PMC article.
-
Evidence that the frontal pole has a significant role in the pathophysiology of schizophrenia.Psychiatry Res. 2022 Nov;317:114850. doi: 10.1016/j.psychres.2022.114850. Epub 2022 Sep 13. Psychiatry Res. 2022. PMID: 36174274 Review.
Cited by
-
Associations between catechol-O-methyltransferase (COMT) genotypes at rs4818 and rs4680 and gene expression in human dorsolateral prefrontal cortex.Exp Brain Res. 2020 Feb;238(2):477-486. doi: 10.1007/s00221-020-05730-0. Epub 2020 Jan 20. Exp Brain Res. 2020. PMID: 31960101
-
PLCβ1 by-passes early growth response -1 to induce the differentiation of neuronal cells.Cell Death Discov. 2024 May 24;10(1):250. doi: 10.1038/s41420-024-02009-z. Cell Death Discov. 2024. PMID: 38789419 Free PMC article.
-
Intracellular compartment-specific proteasome dysfunction in postmortem cortex in schizophrenia subjects.Mol Psychiatry. 2020 Apr;25(4):776-790. doi: 10.1038/s41380-019-0359-7. Epub 2019 Jan 25. Mol Psychiatry. 2020. PMID: 30683941 Free PMC article.
-
Altered PLCβ/IP3/Ca2+ Signaling Pathway Activated by GPRCs in Olfactory Neuronal Precursor Cells Derived from Patients Diagnosed with Schizophrenia.Biomedicines. 2024 Oct 15;12(10):2343. doi: 10.3390/biomedicines12102343. Biomedicines. 2024. PMID: 39457654 Free PMC article.
-
Potential of olfactory neuroepithelial cells as a model to study schizophrenia: A focus on GPCRs (Review).Int J Mol Med. 2024 Jan;53(1):7. doi: 10.3892/ijmm.2023.5331. Epub 2023 Dec 1. Int J Mol Med. 2024. PMID: 38038161 Free PMC article. Review.
References
Grants and funding
LinkOut - more resources
Full Text Sources
Other Literature Sources
