. 2017 May 17;3(5):e1602168.
doi: 10.1126/sciadv.1602168. eCollection 2017 May.

Fast label-free multilayered histology-like imaging of human breast cancer by photoacoustic microscopy

Affiliations

Fast label-free multilayered histology-like imaging of human breast cancer by photoacoustic microscopy

Terence T W Wong et al. Sci Adv. .

Abstract

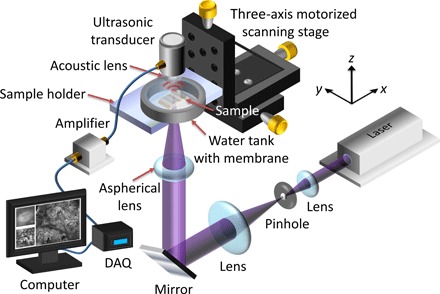
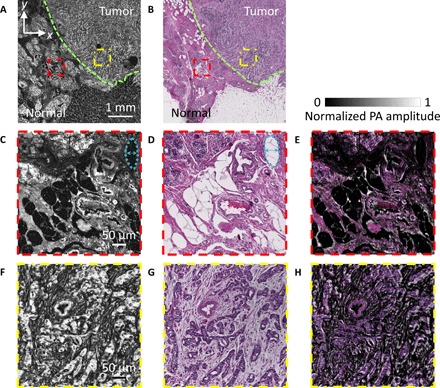
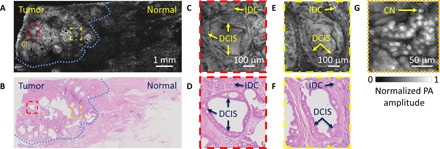
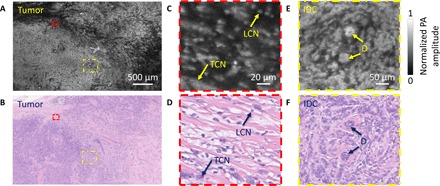
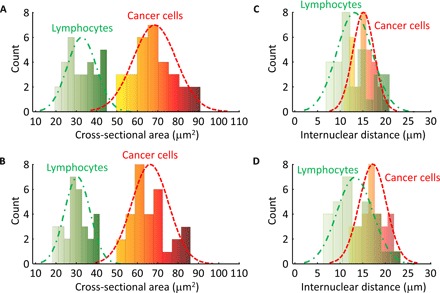
The goal of breast-conserving surgery is to completely remove all of the cancer. Currently, no intraoperative tools can microscopically analyze the entire lumpectomy specimen, which results in 20 to 60% of patients undergoing second surgeries to achieve clear margins. To address this critical need, we have laid the foundation for the development of a device that could allow accurate intraoperative margin assessment. We demonstrate that by taking advantage of the intrinsic optical contrast of breast tissue, photoacoustic microscopy (PAM) can achieve multilayered histology-like imaging of the tissue surface. The high correlation of the PAM images to the conventional histologic images allows rapid computations of diagnostic features such as nuclear size and packing density, potentially identifying small clusters of cancer cells. Because PAM does not require tissue processing or staining, it can be performed promptly and intraoperatively, enabling immediate directed re-excision and reducing the number of second surgeries.

Keywords: Label-free; histology; human breast cancer; margin analysis; multi-layer; photoacoustic imaging; unprocessed tissue.


Figures

Fig. 1
Fig. 1. Schematic of the UV-PAM system for surgical margin imaging.
The UV laser beam is first spatially filtered and expanded by a pair of lenses and a pinhole. The beam is then focused through an aspherical lens onto the bottom of the breast tissue specimen (sample), which is placed inside a water tank on top of a sample holder. Some generated acoustic waves propagate through the tissue and reach a focused ultrasonic transducer. The received acoustic pressure is transduced into an electric signal, which is then amplified and recorded by a data acquisition (DAQ) card. During data acquisition, a maximum amplitude projection (MAP) image from the measured B-scan data is displayed on a computer screen within approximately 1 s. By raster-scanning the sample holder, a MAP image from the C-scan data is also displayed.
Fig. 2
Fig. 2. Imaging of thin breast tissue slices without and with H&E staining.
(A) Unstained paraffin-embedded breast tissue slice imaged by the UV-PAM system. (B) H&E-stained deparaffinized breast tissue slice imaged by a standard microscope. The green dashed lines in (A) and (B) outline the boundaries of the normal and tumor regions. The upper-right area is the tumor region, and the bottom-left area is the normal region. (C and D) Zoomed-in UV-PAM and H&E-stained images of the normal regions (red dashed regions) in (A) and (B), respectively. The blue dashed lines and arrows on the top right-hand corners in (C) and (D) label a representative local deformation. (E) Overlay image of (D) on (C). (F and G) Zoomed-in UV-PAM and H&E-stained images of the tumor regions (yellow dashed regions) in (A) and (B), respectively. (H) Overlay image of (G) on (F).
Fig. 3
Fig. 3. Imaging of a breast tumor from the first patient.
(A) UV-PAM image of the fixed, unprocessed breast tumor. (B) H&E-stained histologic image of the same area shown in (A) acquired after processing, sectioning, and staining the excised breast tissue. The blue dashed lines in (A) and (B) outline the interface between the normal and tumor regions. (C and D) Zoomed-in UV-PAM and H&E-stained images of the red dashed regions in (A) and (B), respectively. (E and F) Zoomed-in UV-PAM and H&E images of the yellow dashed regions in (A) and (B), respectively. IDC, invasive ductal carcinoma; DCIS, ductal carcinoma in situ. (G) Zoomed-in UV-PAM image of the orange dashed region in (A). CN, cell nuclei.
Fig. 4
Fig. 4. Imaging of a breast tumor from the second patient.
(A) UV-PAM image of the fixed, unprocessed breast tumor. (B) H&E-stained histologic image of the same area shown in (A) acquired after processing, sectioning, and staining the excised breast tissue. (C and D) Zoomed-in UV-PAM and H&E images of the red dashed regions in (A) and (B), respectively. LCN, lymphocyte cell nucleus; TCN, tumor cell nucleus. (E and F) Zoomed-in UV-PAM and H&E-stained images of the yellow dashed regions in (A) and (B), respectively. D, duct. The two ducts are surrounded by invasive ductal carcinoma.
Fig. 5
Fig. 5. Distributions of cell nuclear area values and internuclear distances in the breast tumor specimens (Figs. 3 and 4), where bin interval = 8 and n = 30 for each distribution.
(A) Histogram of the cell nuclear cross-sectional areas imaged by UV-PAM (Figs. 3C and 4C). The green dashed line is a Gaussian fit for lymphocytes, with a mean of 32.8 μm2 and an SD of 7 μm2. The red dashed line is a Gaussian fit for cancer cells, with a mean of 67.6 μm2 and an SD of 11 μm2. (B) Histogram of the cell nuclear cross-sectional areas imaged by histology (Figs. 3D and 4D). The green dashed line is a Gaussian fit for lymphocytes, with a mean of 30.1 μm2 and an SD of 6.7 μm2. The red dashed line is a Gaussian fit for cancer cells, with a mean of 66 μm2 and an SD of 9.2 μm2. (C) Histogram of the internuclear distances imaged by UV-PAM (Figs. 3C and 4C). The green dashed line is a Gaussian fit for lymphocytes, with a mean of 13.1 μm and an SD of 3.8 μm. The red dashed line is a Gaussian fit for cancer cells, with a mean of 15.4 μm and an SD of 2.4 μm. (D) Histogram of the internuclear distances imaged by histology (Figs. 3D and 4D). The green dashed line is a Gaussian fit for lymphocytes, with a mean of 13.2 μm and an SD of 4.1 μm. The red dashed line is a Gaussian fit for cancer cells, with a mean of 17.2 μm and an SD of 2.9 μm.

References

    1. American Cancer Society, “Breast Cancer Facts & Figures 2015–2016” (American Cancer Society Inc., 2015).
    1. Moran M. S., Schnitt S. J., Giuliano A. E., Harris J. R., Khan S. A., Horton J., Klimberg S., Chavez-MacGregor M., Freedman G., Houssami N., Johnson P. L., Morrow M., Society of Surgical Oncology–American Society for Radiation Oncology consensus guideline on margins for breast-conserving surgery with whole-breast irradiation in stages I and II invasive breast cancer. J. Clin. Oncol. 88, 553–564 (2014). - PMC - PubMed
    1. van Dongen J. A., Voogd A. C., Fentiman I. S., Legrand C., Sylvester R. J., Tong D., van der Schueren E., Helle P. A., van Zijl K., Bartelink H., Long-term results of a randomized trial comparing breast-conserving therapy with mastectomy: European Organization for Research and Treatment of Cancer 10801 trial. J. Natl. Cancer Inst. 92, 1143–1150 (2000). - PubMed
    1. Park C. C., Mitsumori M., Nixon A., Recht A., Connolly J., Gelman R., Silver B., Hetelekidis S., Abner A., Harris J. R., Schnitt S. J., Outcome at 8 years after breast-conserving surgery and radiation therapy for invasive breast cancer: Influence of margin status and systemic therapy on local recurrence. J. Clin. Oncol. 18, 1668–1675 (2000). - PubMed
    1. Kunos C., Latson L., Overmoyer B., Silverman P., Shenk R., Kinsella T., Lyons J., Breast conservation surgery achieving ≥ 2 mm tumor-free margins results in decreased local-regional recurrence rates. Breast J. 12, 28–36 (2006). - PubMed

MeSH terms