

Hepatocyte-specific expression of constitutively active Alk5 exacerbates thioacetamide-induced liver injury in mice
- PMID: 28560358
- PMCID: PMC5440359
- DOI: 10.1016/j.heliyon.2017.e00305
Hepatocyte-specific expression of constitutively active Alk5 exacerbates thioacetamide-induced liver injury in mice
Abstract
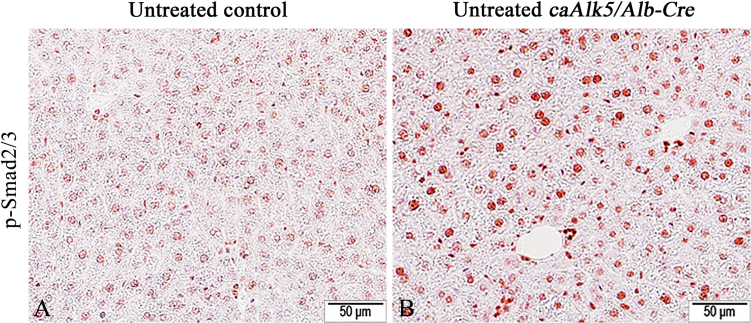
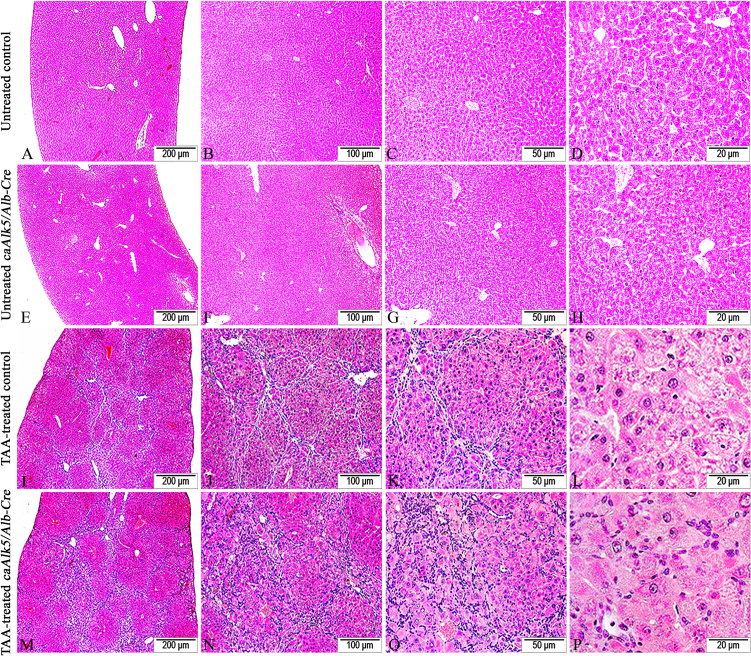
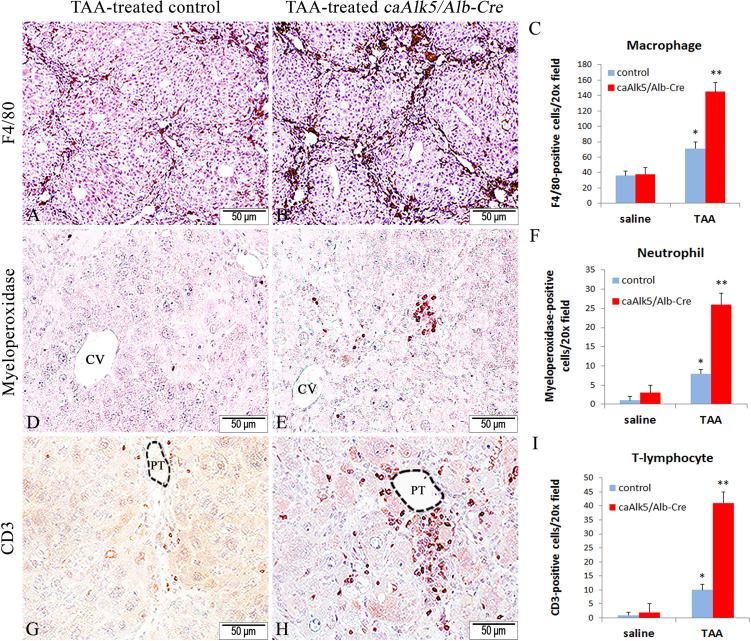
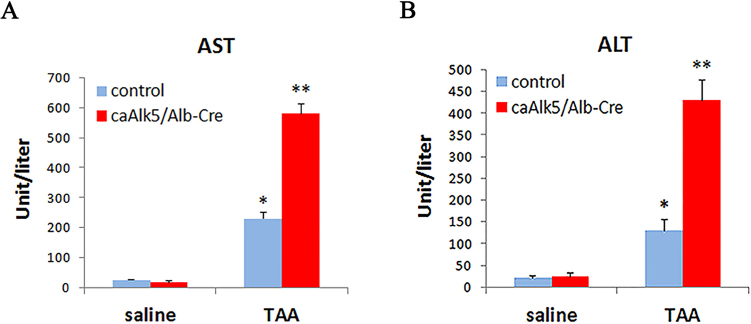
While Transforming growth factor-βs (Tgf-βs) have been known to play an important role in liver fibrosis through an activation of Hepatic Stellate Cells (HSC), their fibrotic role on hepatocytes in liver damage has not been addressed thoroughly. To shed more light on the hepatocyte-specific role of Tgf-β signaling during liver fibrosis, we generated transgenic mice expressing constitutively active Tgf-β type I receptor Alk5 under the control of albumin promoter. Uninjured mice with increased Tgf-β/Alk5 signaling in hepatocytes (caAlk5/Alb-Cre mice) did not show characteristics related to hepatocyte death, fibrosis and inflammation. When subjected to thioacetamide (TAA) treatment, caAlk5/Alb-Cre mice exhibited more severe liver injury, when compared to control littermates. After TAA administration for 12 weeks, an increase in pathological changes was evident in caAlk5/Alb-Cre livers, with higher number of infiltrating cells in the portal and periportal area. Immunohistochemistry for F4/80, myeloperoxidase and CD3 showed that there was an increased accumulation of macrophages, neutrophils and T-lymphocytes, respectively, in caAlk5/Alb-Cre livers. Coincidently, we observed an exacerbated liver damage as seen by increases in serum aminotransferase level and number of apoptotic hepatocytes in caAlk5/Alb-Cre mice. Sirius staining of collagen demonstrated that the fibrotic response was worsened in caAlk5/Alb-Cre mice. The enhanced fibrosis in mutant livers was associated with marked production of α-SMA-positive myofibroblast. Hepatic expression of genes indicative of HSC activation was greater in caAlk5/Alb-Cre mice. In conclusion, our data indicated that elevation of Tgf-β signaling via Alk5 in hepatocytes is not sufficient to induce liver pathology but plays an important role in amplifying TAA-induced liver damage.
Keywords: Pathology; Toxicology.
Figures


Similar articles
-
Cell-specific PPARγ deficiency establishes anti-inflammatory and anti-fibrogenic properties for this nuclear receptor in non-parenchymal liver cells.J Hepatol. 2013 Nov;59(5):1045-53. doi: 10.1016/j.jhep.2013.06.023. Epub 2013 Jul 2. J Hepatol. 2013. PMID: 23831119
-
Cooperation of liver cells in health and disease.Adv Anat Embryol Cell Biol. 2001;161:III-XIII, 1-151. doi: 10.1007/978-3-642-56553-3. Adv Anat Embryol Cell Biol. 2001. PMID: 11729749 Review.
-
Selective deletion of hepatocyte platelet-derived growth factor receptor α and development of liver fibrosis in mice.Cell Commun Signal. 2018 Dec 3;16(1):93. doi: 10.1186/s12964-018-0306-2. Cell Commun Signal. 2018. PMID: 30509307 Free PMC article.
-
Essential role of suppressor of cytokine signaling 1 (SOCS1) in hepatocytes and macrophages in the regulation of liver fibrosis.Cytokine. 2019 Dec;124:154501. doi: 10.1016/j.cyto.2018.07.032. Epub 2018 Aug 8. Cytokine. 2019. PMID: 30097285
-
Hepatocyte-specific deletion of ARNT (aryl hydrocarbon Receptor Nuclear Translocator) results in altered fibrotic gene expression in the thioacetamide model of liver injury.PLoS One. 2015 Mar 26;10(3):e0121650. doi: 10.1371/journal.pone.0121650. eCollection 2015. PLoS One. 2015. PMID: 25812120 Free PMC article.
Cited by
-
Liver regeneration during the associating liver partition and portal vein ligation for staged hepatectomy procedure in Sus scrofa is positively modulated by stem cells.Oncol Lett. 2018 May;15(5):6309-6321. doi: 10.3892/ol.2018.8108. Epub 2018 Feb 22. Oncol Lett. 2018. PMID: 29616108 Free PMC article.
-
Macrophage expression of constitutively active TβRI alleviates hepatic injury in a mouse model of concanavalin A-induced autoimmune hepatitis.Heliyon. 2025 Feb 13;11(4):e42691. doi: 10.1016/j.heliyon.2025.e42691. eCollection 2025 Feb 28. Heliyon. 2025. PMID: 40040984 Free PMC article.
References
-
- Bartholin L. Generation of mice with conditionally activated transforming growth factor beta signaling through the TbetaRI/ALK5 receptor. Genesis. 2008;46:724–731. - PubMed
-
- Basciani S. Expression of platelet-derived growth factor (PDGF) in the epididymis and analysis of the epididymal development in PDGF-A PDGF-B, and PDGF receptor beta deficient mice. Biol. Reprod. 2004;70:168–177. - PubMed
-
- Diehl A.M. Neighborhood watch orchestrates liver regeneration. Nat. Med. 2012;18:497–499. - PubMed
LinkOut - more resources
Full Text Sources
Other Literature Sources
Research Materials
Miscellaneous
