. 2017 Aug;38(8):4169-4184.
doi: 10.1002/hbm.23656. Epub 2017 May 31.

Network component analysis reveals developmental trajectories of structural connectivity and specific alterations in autism spectrum disorder

Affiliations

Network component analysis reveals developmental trajectories of structural connectivity and specific alterations in autism spectrum disorder

Gareth Ball et al. Hum Brain Mapp. 2017 Aug.

Abstract

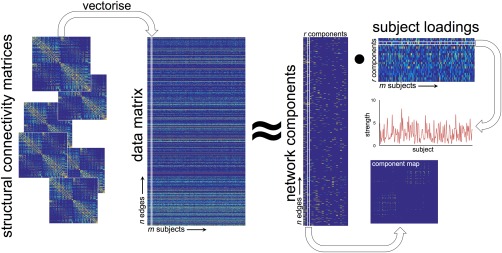
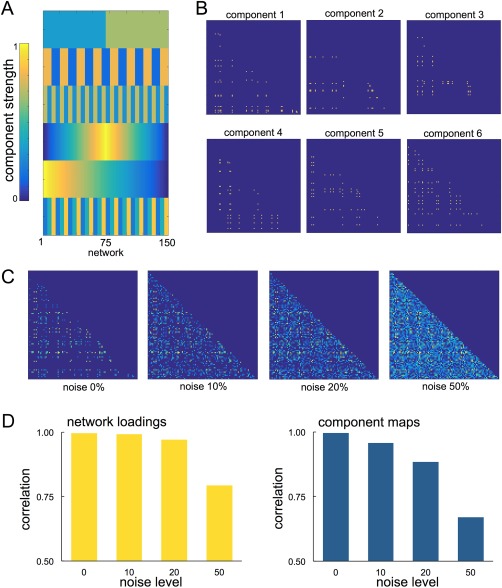
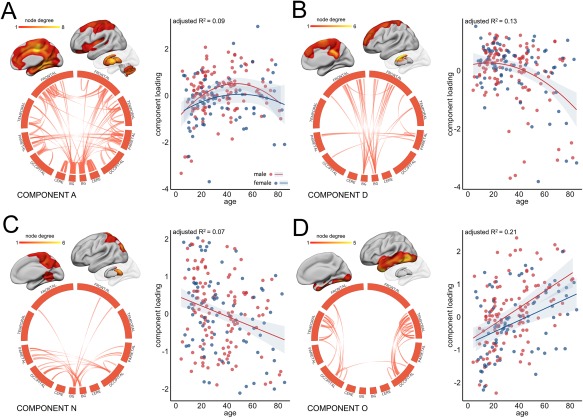
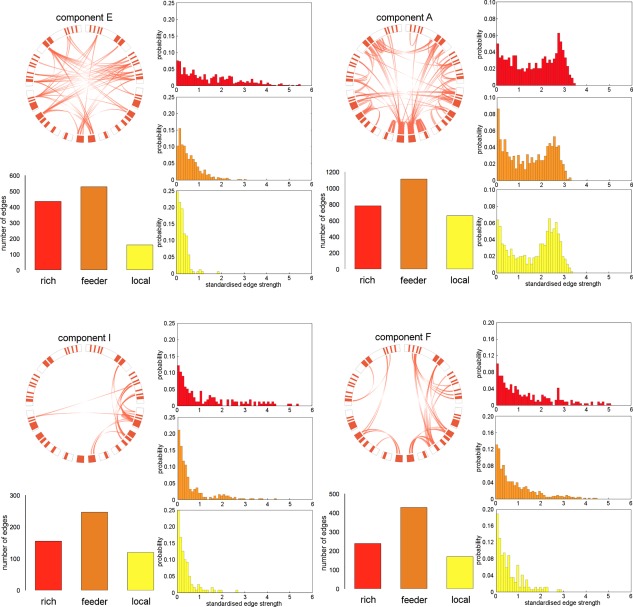
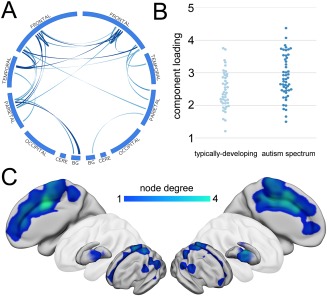
The structural organization of the brain can be characterized as a hierarchical ensemble of segregated modules linked by densely interconnected hub regions that facilitate distributed functional interactions. Disturbances to this network may be an important marker of abnormal development. Recently, several neurodevelopmental disorders, including autism spectrum disorder (ASD), have been framed as disorders of connectivity but the full nature and timing of these disturbances remain unclear. In this study, we use non-negative matrix factorization, a data-driven, multivariate approach, to model the structural network architecture of the brain as a set of superposed subnetworks, or network components. In an openly available dataset of 196 subjects scanned between 5 and 85 years we identify a set of robust and reliable subnetworks that develop in tandem with age and reflect both anatomically local and long-range, network hub connections. In a second experiment, we compare network components in a cohort of 51 high-functioning ASD adolescents to a group of age-matched controls. We identify a specific subnetwork representing an increase in local connection strength in the cingulate cortex in ASD (t = 3.44, P < 0.001). This work highlights possible long-term implications of alterations to the developmental trajectories of specific cortical subnetworks. Hum Brain Mapp 38:4169-4184, 2017. © 2017 Wiley Periodicals, Inc.

Keywords: brain development; connectivity; networks; non-negative matrix factorization.


Figures

Figure 1
Figure 1
Projective NMF pipeline. Individual connectivity matrices are concatenated into a large data matrix. Projective NMF is used to decompose the data into a set of network components. A map of connections shows the topological organization of each component, or subnetwork, and a subject‐specific weighting estimates the component's contribution each individual's full network. [Color figure can be viewed at http://wileyonlinelibrary.com]
Figure 2
Figure 2
Simulating networks for PNMF decomposition. Component weights (A) and spatial maps (B) for simulating connectivity networks. Each component was weighted according to the corresponding component strength and summed to form a network. Noise was added at four levels to the final network (C). The mean correlation between recovered component loadings and the original network weights is shown in D, alongside the spatial correlation between recovered maps and the original component maps at each noise level. [Color figure can be viewed at http://wileyonlinelibrary.com]
Figure 3
Figure 3
Age‐related variation in component strength. Four network components are highlighted as examples of age‐related variation in subnetwork connectivity (see Supporting Information Figure S1 for all components). For visualization, components maps were thresholded at the 95th percentile and connections are shown in circular format. To show the anatomical location of connected regions, node degree was calculated for each cerebral ROI as the sum of its connections in the thresholded component and projected onto cortical/subcortical surfaces. The relationship between (normalized) component strength and age was modeled using polynomial regression. The best model fit is shown for each component. Separate model fits indicate when sex was included as an additional factor. Red indicates male; blue, female. Cere = cerebellum, BG = basal ganglia and thalamus. [Color figure can be viewed at http://wileyonlinelibrary.com]
Figure 4
Figure 4
Rich network components. Network components with significantly more rich‐club edges than in a set of 1,000 equivalent random networks are shown. Thresholded connectivity maps are displayed in circular diagrams as in Figure 3, with rich club nodes highlighted in red. The number and probability distribution of rich, feeder, and local edges are displayed for each component. [Color figure can be viewed at http://wileyonlinelibrary.com]
Figure 5
Figure 5
Local network components. Network components with significantly more local edges than in a set of 1,000 equivalent random networks are shown. Connectivity maps and edge distributions are shown as in Figure 4. [Color figure can be viewed at http://wileyonlinelibrary.com]
Figure 6
Figure 6
Structural connectivity is significantly increased in ASD. A single subnetwork was found to be significantly stronger in the ASD cohort. The component map is shown in A (thresholded at 95th percentile), and component loadings for both groups compared in B. The anatomical locations of connected regions are visualized as in Figure 3 and shown in C. [Color figure can be viewed at http://wileyonlinelibrary.com]

References

    1. Abou Elseoud A, Littow H, Remes J, Starck T, Nikkinen J, Nissilä J, Timonen M, Tervonen O, Kiviniemi V (2011): Group‐ICA model order highlights patterns of functional brain connectivity. Front Syst Neurosci 5:37. - PMC - PubMed
    1. Agam Y, Joseph RM, Barton JJS, Manoach DS (2010): Reduced cognitive control of response inhibition by the anterior cingulate cortex in autism spectrum disorders. NeuroImage 52:336–347. - PMC - PubMed
    1. Alexander‐Bloch A, Raznahan A, Bullmore E, Giedd J (2013): The convergence of maturational change and structural covariance in human cortical networks. J Neurosci 33:2889–2899. - PMC - PubMed
    1. Andrews‐Hanna JR, Snyder AZ, Vincent JL, Lustig C, Head D, Raichle ME, Buckner RL (2007): Disruption of large‐scale brain systems in advanced aging. Neuron 56:924–935. - PMC - PubMed
    1. Bailey A, Luthert P, Dean A, Harding B, Janota I, Montgomery M, Rutter M, Lantos P (1998): A clinicopathological study of autism. Brain J Neurol 121 (Pt 5):889–905. - PubMed

Publication types

MeSH terms