. 2017 May 31:8:15508.
doi: 10.1038/ncomms15508.

IL-17 induced NOTCH1 activation in oligodendrocyte progenitor cells enhances proliferation and inflammatory gene expression

Affiliations

IL-17 induced NOTCH1 activation in oligodendrocyte progenitor cells enhances proliferation and inflammatory gene expression

Chenhui Wang et al. Nat Commun. .

Abstract

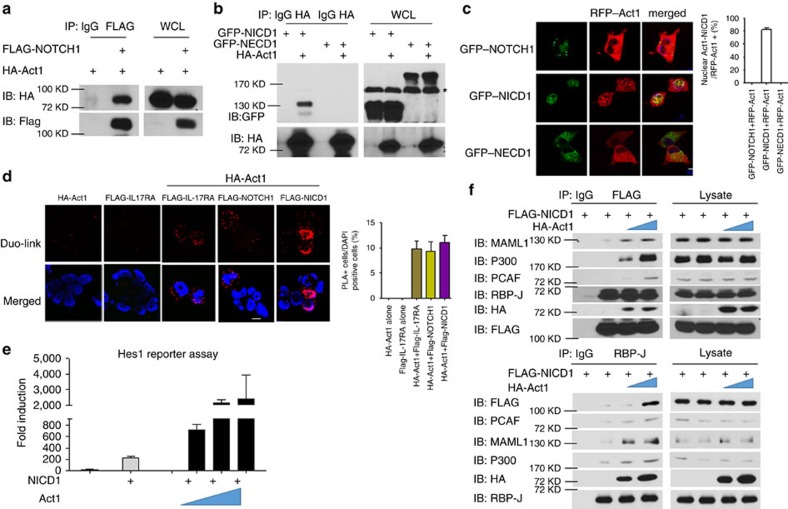
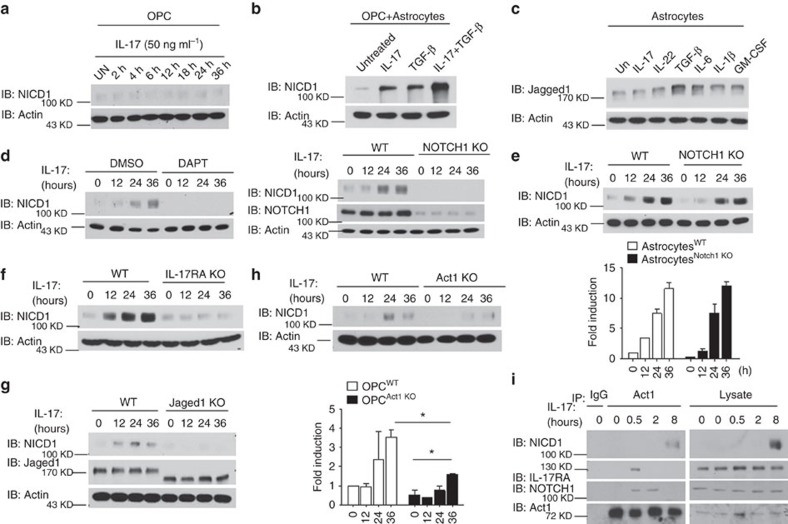
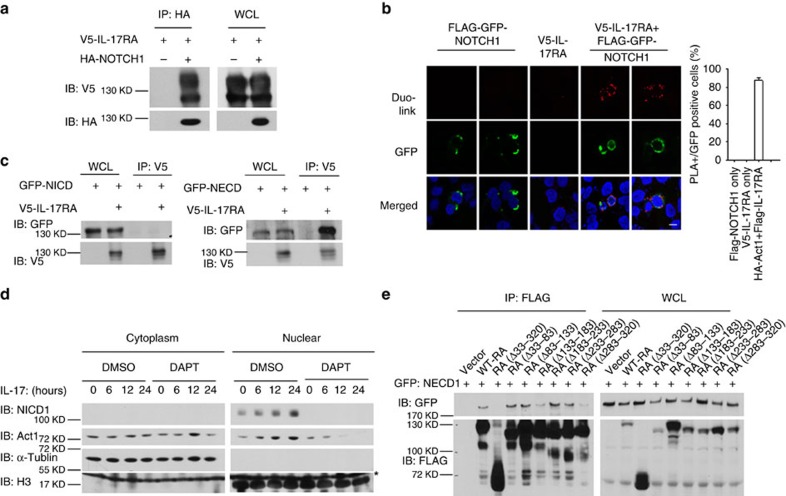
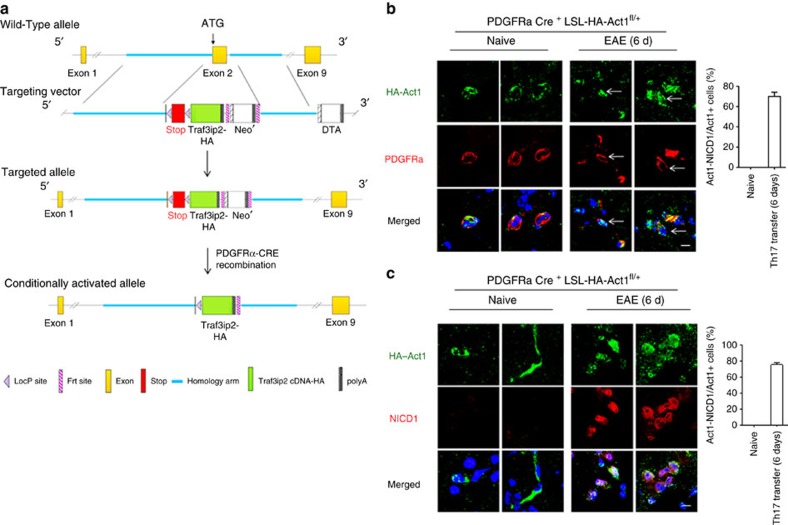
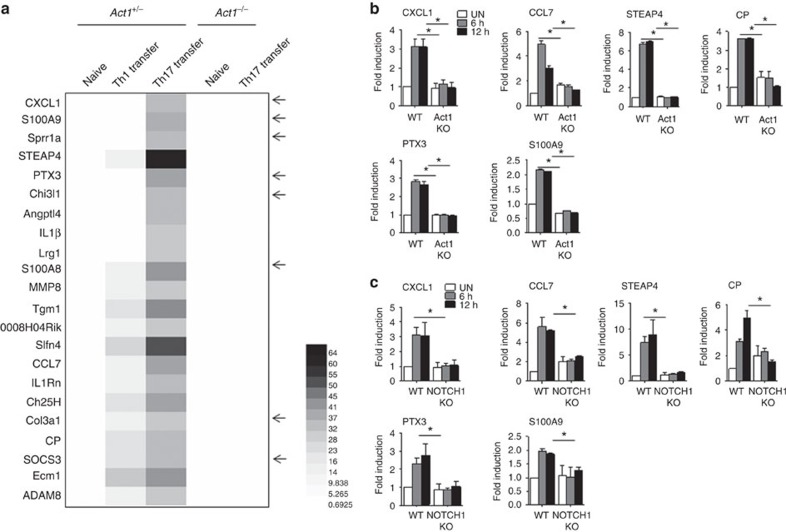
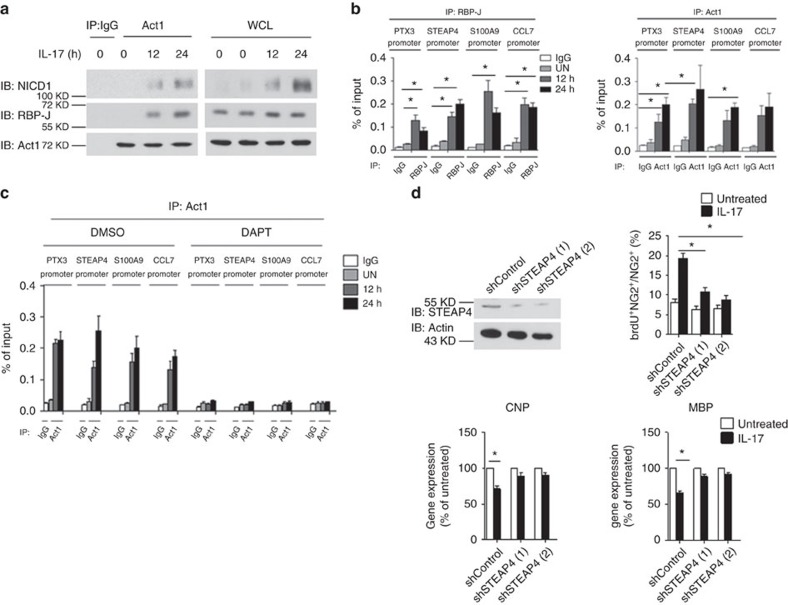
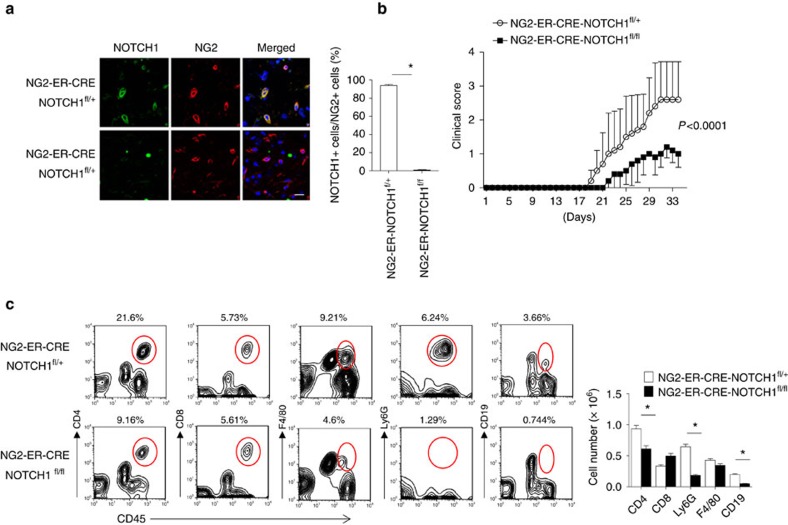
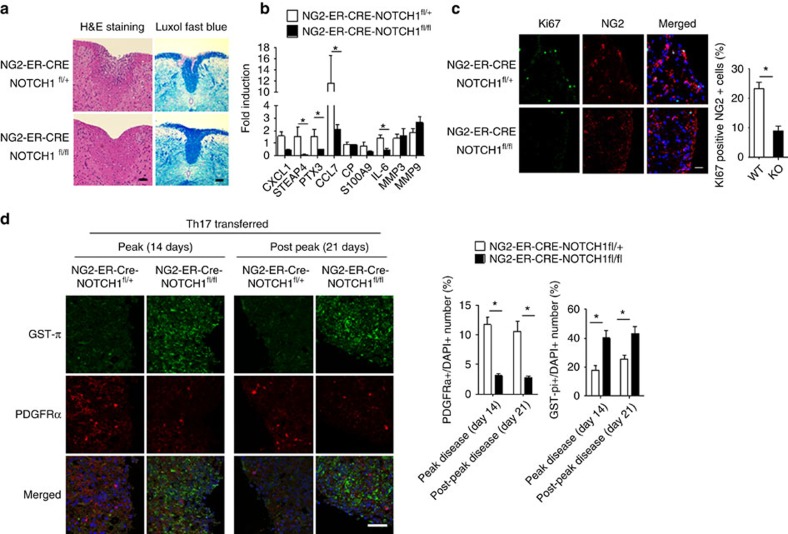
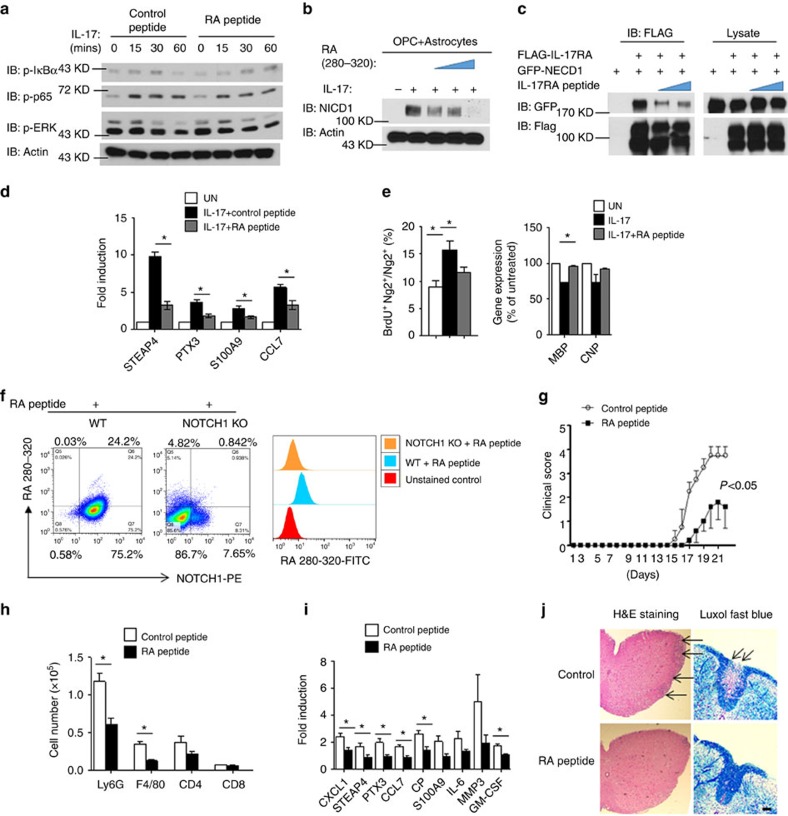
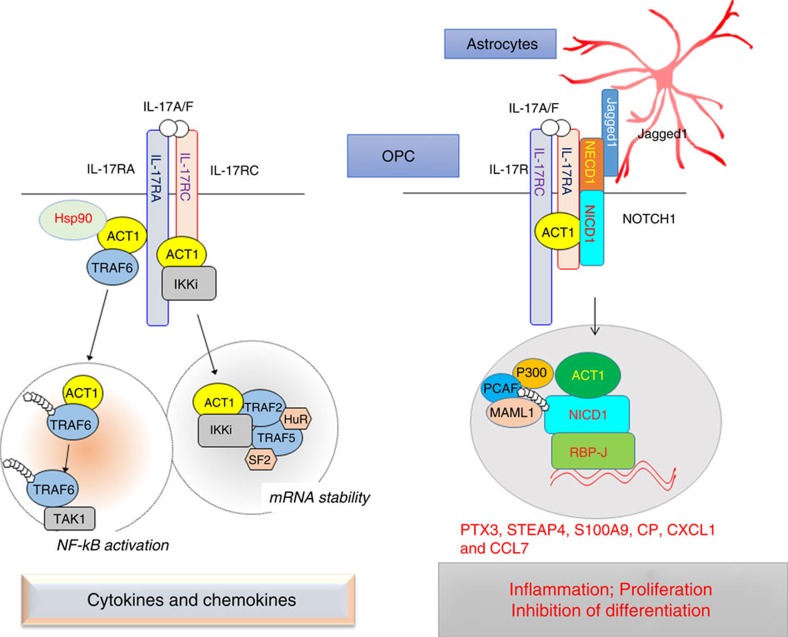
NOTCH1 signalling contributes to defective remyelination by impairing differentiation of oligodendrocyte progenitor cells (OPCs). Here we report that IL-17 stimulation induces NOTCH1 activation in OPCs, contributing to Th17-mediated demyelinating disease. Mechanistically, IL-17R interacts with NOTCH1 via the extracellular domain, which facilitates the cleavage of NOTHC1 intracellular domain (NICD1). IL-17-induced NOTCH1 activation results in the interaction of IL-17R adaptor Act1 with NICD1, followed by the translocation of the Act1-NICD1 complex into the nucleus. Act1-NICD1 are recruited to the promoters of several NOTCH1 target genes (including STEAP4, a metalloreductase important for inflammation and cell proliferation) that are specifically induced in the spinal cord by Th17 cells. A decoy peptide disrupting the IL-17RA-NOTCH1 interaction inhibits IL-17-induced NOTCH1 activation and attenuates Th17-mediated experimental autoimmune encephalitis (EAE). Taken together, these findings demonstrate critical crosstalk between the IL-17 and NOTCH1 pathway, regulating Th17-induced inflammatory and proliferative genes to promote demyelinating disease.


Conflict of interest statement

The authors declare no competing financial interests.

Figures

Figure 1
Figure 1. Act1 directly interact with NOTCH1 through NICD1.
(a) HEK293 cells were transfected with HA–Act1 alone or in combination with FLAG-NOTCH1. Cell lysates were immunoprecipitated with anti-FLAG antibody, followed by immunoblot analysis for indicated proteins. (b) HEK293 cells were transfected with GFP–NICD1, GFP–NECD1 and HA–Act1 alone or in combination as indicated. Cell lysates were immunoprecipitated with anti-HA antibody, followed by immunoblot analysis for the indicated proteins. Asterisk indicates non-specific band. (c) HeLa cells were transfected with GFP–NOTCH1, GFP–NICD1, GFP–NECD1 and RFP–Act1 as indicated. Images were acquired using confocal microscopy under a × 60 objective; scale bar, 20 μm. Frequencies of cells showing Act1–NICD co-localization in the nuclei in the total RFP-positive cells are shown in bar graphs. (d) HeLa cells were transfected with HA–Act1 alone or in combination with indicated plasmids. In situ PLA was performed by using rabbit anti-FLAG and mouse anti-HA antibodies followed by proximity ligation (see Methods section) and DAPI staining. Red: PLA signal indicating protein–protein interaction; blue: nuclei. Images were acquired using confocal microscopy under a × 60 objective; scale bar, 20 μm. Frequencies of PLA-positive cells are shown in bar graphs. (e) HeLa cells were transfected with Hes1-luciferase reporter (100 ng) alone or with indicated combinations of human NICD cDNA (200 ng) and increasing amounts of human Act1 cDNA (0, 100, 200 and 500 ng). Data are plotted as fold induction of luciferase activity from cells with indicated transfection over that of the Hes1-luciferase transfection alone. (f) HEK293 cells were transfected with FLAG–NICD1 (3 μg) with increasing amounts of HA–Act1 (3 and 6 μg). Cell lysates were immunoprecipitated with anti-FLAG (upper panel) or anti-RBP-J antibody (lower panel), followed by immunoblot analysis for the indicated antibodies. IgG, immunoglobulin G; IB, immunoblotting; IP, immunoprecipitation; WCL, whole-cell lysates. Arrow indicates the band for FLAG–NICD1. *P<0.05 based on Mann–Whitney U-test. All error bars represent s.e.m. of technical replicates. Data are representative of three independent experiments.
Figure 2
Figure 2. IL-17 activates NOTCH pathway in OPCs co-cultured with astrocytes.
(a) OPCs were stimulated with IL-17 (50 ng ml−1) for indicated time, followed by immunoblot analysis for indicated proteins. (b) OPC-astrocyte co-cultures were treated with IL-17 (50 ng ml−1), TGF-β (10 ng ml−1) or IL-17+TGF-β for 24 h, followed by immunoblot analysis for indicated proteins. (c) Astrocytes were left untreated or treated with IL-17 (50 ng ml−1), IL-22 (10 ng ml−1), TGF-β (10 ng ml−1), IL-6 (10 ng ml−1), IL−1β (1 ug ml−1) and GM-CSF (10 ng ml−1) for 24 h, followed by immunoblot analysis for Jagged1 and Actin. (d) OPC-astrocyte co-cultures were pretreated with dimethylsulfoxide (DMSO) or DAPT (10 μM) for 6 h. Pretreated cells were stimulated with IL-17 (50 ng ml−1) for the indicated times, followed by immunoblot analysis (left panel). Co-cultured wild-type or NOTCH1 knockout (KO) OPCs were stimulated with IL-17 (50 ng ml−1) for the indicated time, followed by immunoblot analysis (right panel). (e) OPCs co-cultured with wild-type or NOTCH1 KO astrocytes were stimulated with IL-17 (50 ng ml−1) for the indicated time, followed by immunoblot analysis. Densitometric quantification of western blots from two independent experiments is shown as fold induction of NICD1 in IL-17-treated cells over untreated cells. (f) Co-cultured wild-type or IL-17RA KO OPCs were stimulated with IL-17 (50 ng ml−1) for the indicated times, followed by immunoblot analysis for indicated proteins. (g) OPCs co-cultured with wild-type or Jagged1 KO astrocytes were stimulated with IL-17 (50 ng ml−1) for the indicated time, followed by immunoblotting analysis. Densitometric quantification is performed as described for e. (h) Co-cultured wild-type or Act1 KO OPCs were stimulated with IL-17 (50 ng ml−1) for the indicated times, followed by immunoblot analysis for indicated proteins. Densitometric quantification of western blots from two independent experiments is shown as fold induction of NICD1 in IL-17-treated cells over untreated cells. (i) OPCs co-cultured with Act1 KO astrocytes were stimulated with IL-17 (50 ng ml−1) for indicated time. Cell lysates were immunoprecipitated with anti-Act1 antibody, followed by immunoblot analysis. All error bars represent s.e.m. of technical replicates *P<0.05 based on Mann–Whitney U-test. Data are representative of three independent experiments.
Figure 3
Figure 3. IL-17 activate NOTCH pathway through direct interaction between NOTCH1 and IL-17R.
(a) HEK293 cells were transfected with V5-IL-17RA alone or in combination with HA–NOTCH1. Cell lysates were immunoprecipitated with anti-HA antibody, followed by immunoblot analysis for indicated proteins. (b) HeLa cells were transfected with FLAG–GFP–NOTCH1 and V5-IL-17RA alone or in combination as indicated. In situ PLA were performed using rabbit anti-FLAG and mouse anti-V5 antibodies, followed by in situ proximity ligation and DAPI staining. Green: GFP (NOTCH1); red: PLA signal; blue: nuclei. Images were acquired using confocal microscopy under a × 60 objective; scale bar, 20 μm. Frequencies of PLA-positive cells in GFP-positive cells are shown in bar graph. (c) HEK293 cells were transfected with GFP–NICD1 (left panel) or NECD1 (right panel) with or without V5-IL-17RA. Cell lysates were immunoprecipitated with anti-V5 antibody, followed by immunoblot analysis for indicated proteins. (d) OPCs co-cultured with IL-17RA KO astrocytes were pretreated with DMSO or DAPT (10 μM) for 6 h. Pretreated cells were then stimulated with IL-17 (50 ng ml−1) for indicated times, followed by cytoplasm-nucleus fractionation. Cell fractionations were analysed by immunoblot for indicated proteins. Arrow indicates H3 bands and asterisk indicates non-specific band. (e) HEK293 cells were transfected with GFP–NECD1 in combination with vector or FLAG-tagged IL-17RA deletion mutants as indicated. Cell lysates were immunoprecipitated with anti-FLAG antibody, followed by immunoblot analysis for indicated proteins. IB, immunoblotting; IP, immunoprecipitation; WCL, whole-cell lysates. Error bars represent s.e.m. of technical replicates *P<0.05 based on Mann–Whitney U-test. Data are representative of three independent experiments.
Figure 4
Figure 4. Th17 adoptive transfer induces NOTCH1 pathway activation and NICD1–Act1 translocation to the nucleus of OPCs in vivo.
(a) Design and generation of the LSL–HA–Act1 knock-in mice. See the experimental procedure for the details. (b,c) PDGFRα-CRE+ LSL–HA–Act1 mice were left untreated (naive) or transferred with MOG-reactive Th17 cells to induce EAE. Mice were killed 6 days later. Frozen sections of brain tissue from experimental mice were stained to visualize HA–Act1, PDGFRα (b) or NICD (c). Images were acquired using confocal microscopy under a × 60 objective. Scale bar, 10 μm. Frequencies of cells showing Act1–NICD co-localization in Act1-positive cells are shown in bar graph. Error bar represents s.e.m. of biological replicates (mice). *P<0.05 based on Mann–Whitney U-test. Data are representative of three independent experiments.
Figure 5
Figure 5. IL-17 induces NOTCH1-dependent genes in co-cultured OPCs.
(a) Wild-type and Act1 KO mice were left untreated or transferred with Th1 or Th17 cell to induce EAE. At the peak of the disease, mice were killed, and spinal cords were subjected to microarray analysis. Genes specifically induced by Th17 comparing to the spinal cords from naive mice are shown in the heat map (the arrows indicate NOTCH target genes reported in the literature414243). (b) Wild-type or Act1 KO OPCs co-cultured with Act1 KO astrocytes were stimulated with IL-17 (50 ng ml−1) for indicated time, followed by RT–PCR analysis for indicated genes. (c) Wild-type or NOTCH1 KO OPCs co-cultured with Act1 KO astrocytes were stimulated with IL-17 (50 ng ml−1) for indicated time, followed by RT–PCR analysis for indicated genes. *P<0.05 based on Mann–Whitney U-test. All error bars represent s.e.m. of technical replicates. Data are representative of three independent experiments.
Figure 6
Figure 6. Act1 binds to the promoters of NOTCH1-depdnent genes in response to IL-17 stimulation.
(a) Wild-type OPCs co-cultured with Act1 KO astrocytes were stimulated with IL-17 (50 ng ml−1) for the indicated time. Cell lysates were immunoprecipitated with anti-Act1 antibody, followed by immunoblot. (b) Wild-type OPCs co-cultured with Act1 KO astrocytes were stimulated with IL-17 (50 ng ml−1) for indicated time. Stimulated cells were subjected to ChIP assay using anti-RBP-J or anti-Act1 antibodies for the enrichment of indicated promoters. (c) Wild-type OPCs co-cultured with Act1 KO astrocytes were pretreated with DMSO or DAPT (10 μM) for 6 h. Pretreated cells were stimulated with IL-17 (50 ng ml−1) for the indicated time, followed by ChIP assay using RBP-J and Act1 antibodies for indicated promoters. (d) NG2+ OPCs cells were lentivirally transduced with control shRNA (shControl) or two different shRNAs targeting STEAP4. Efficiency of knockdown was determined by immunoblot analysis. Infected NG2+ OPCs cells co-cultured with Act1 KO astrocytes were subjected to BrdU incorporation assay after IL-17 (50 ng ml−1) treatment for 24 h. A total of 1,000 NG2+ cells were enumerated from 10 different views for BrdU positivity (upper panel). NG2+ OPCs cells transduced with control shRNA or shRNA targeting STEAP4 were co-cultured with Act1 KO astrocytes and treated with IL-17 (50 ng ml−1) for 24 h. Expressions of CNP and MBP were analysed by RT–PCR (lower panel). IB, immunoblotting; IP, immunoprecipitation; WCL, whole-cell lysates CNP, 2',3'-Cyclic nucleotide 3'-phosphodiesterase; MBP, myelin basic protein. *P<0.05 based on Mann–Whitney U-test. All error bars represent s.e.m. of technical replicates. Data are representative of three independent experiments.
Figure 7
Figure 7. NOTCH1 deficiency in NG2+> OPCs attenuates Th17-induced EAE.
(a) Transversal sections of lumbar spinal cords from mice of indicated genotypes (n=5) were stained with anti-NG2 (red) and anti-NOTCH1 (green) antibodies. Images were then acquired using confocal microscopy under a × 60 objective; scale bar, 20 μm. Frequencies of NOTCH1 NG2+ cells were determined to assess deletion efficiency. (b) Mice of indicated genotypes were adoptively transferred with MOG-reactive Th17 cells (n=5) to induce EAE. Spinal cords were collected at peak of disease. Clinical scores of EAE symptoms in mice described for a are graphed over the experimental time course. (P<0.0001 based on two-way ANOVA). (c) Infiltrating cells in the brains of mice with Th17-induced EAE (n=5) were isolated at the peak of the disease, followed by flow cytometry analysis. The numbers of different infiltrating cells were calculated for each mouse. All error bars represent s.e.m. of biological replicates. *P<0.05 based on Mann–Whitney U-test. Data are representative of three independent experiments.
Figure 8
Figure 8. NOTCH1 deficiency in NG2+ OPCs reduces cell proliferation and inflammatory gene expression.
(a) Haematoxylin and LFB staining of transversal sections of lumbar spinal cords from mice with Th17-induced EAE. Scale bars, 50 μm (left panel), 100 μm (right panel). (b) RT–PCR analysis of inflammatory gene expression in spinal cords from EAE mice (n=5) of indicated genotypes. (c) Transversal frozen sections of lumbar spinal cords described for b were stained with anti-NG2 (red) and anti-Ki67 (green) antibodies. The number of total NG2+ cells and Ki67+ NG2+ double-positive cells were enumerated from three inconsecutive sections from the same spinal cord. Average percentage of Ki67+ NG2+ cells were calculated. Means of the percentage of each genotype (n=5) are plotted. Images were acquired using confocal microscopy with a × 60 objective; scale bar, 40 μm. (d) Spinal cords from indicated mice were collected 14 days or 21 days after the peak of Th17-induced EAE. Transversal sections of lumbar spinal cords were stained with anti-GST-π (green) and anti-PDGFRα (red) antibodies. Frequency of GST-π-positive and PDGFRα-positive cells were determined by manual determination. Error bars represent s.e.m. of biological replicates. *P<0.05 based on Mann–Whitney U-test. Data are representative of two independent experiments.
Figure 9
Figure 9. Disrupting IL-17RA–NOTCH1 interaction attenuates Th17-induced EAE.
(a) Mouse embryonic fibroblasts were pretreated with control peptide or IL-17RA decoy peptide for 2 h (200 μM). Pretreated cells were stimulated with IL-17 (50 ng ml−1) for indicated time, followed by immunoblot analysis. (b) OPCs co-cultured with Act1 KO astrocytes were stimulated by IL-17 (50 ng ml−1) in the presence of different doses of IL-17RA decoy peptide (50,100 and 200 μM), followed by immunoblotting analysis. (c) HEK293 cells were transfected with indicated constructs. IL-17RA decoy peptide (100 or 200 μM) was added after transfection. Cell lysates were immunoprecipitated with anti-FLAG antibody, followed by immunoblot analysis. (d) OPCs co-cultured with IL-17RA KO astrocytes were pretreated with IL-17RA decoy peptide (200 μM) or left untreated followed by IL-17 stimulation (50 ng ml−1). Expressions of indicated genes were analysed by RT–PCR. (e) OPCs co-cultured with IL-17RA KO astrocytes were pretreated with RA peptide (200 μM) or left untreated followed by IL-17 (50 ng ml−1) stimulation. Treated cells were subjected BrdU incorporation assay. A total of 1,000 NG2+ cells were enumerated from 10 different views for BrdU positivity (left panel). Cells receiving the same treatment were analysed for MBP and CNP expression (right panel). (f) Wild-type OPCs and NOTCH1 KO OPCs were incubated for FITC-labelled IL-17RA decoy peptide (200 μM) followed by staining with fluorophore (PE)-labelled anti-NOTCH1 antibody. Cells were analysed by flow cytometry for FITC and PE signal. (g) Clinical scores of EAE symptoms of mice receiving indicated treatment (P<0.001, two-way ANOVA). (h) Infiltrating cells from the brain of EAE mice (n=5) receiving indicated treatment were analysed by flow cytometry. (i) RT–PCR analysis of inflammatory gene expression in spinal cords of mice receiving indicated treatment (n=5). (j) H&E and LFB staining of sections of spinal cords from mice receiving indicated treatment. Arrow in the H&E staining indicates infiltrated area, and arrow in the LFB staining indicates demyelination area. Scale bar, 100 μm. IB, immunoblotting; IP, immunoprecipitation; WCL, whole-cell lysates. All error bars represent s.e.m. of biological replicates. *P<0.05 based on Mann–Whitney U-test. Data are representative of two independent experiments.
Figure 10
Figure 10. Model of IL-17–NOTCH pathway.
Left panel: canonical IL-17 signalling. IL-17 signals through a heterodimeric receptor complex composed of IL-17RA and IL-17RC. On IL-17 stimulation, Act1 is recruited to IL-17R and subsequently engages TRAF6 and Hsp90 to activate NF-κB pathway. In addition, IL-17 stimulation also promotes the formation of Act1–IKKi complex, which in turn engages TRAF2 and TRAF5 to activate the mRNA stabilization pathway. Canonical IL-17 signalling results in transcription of pro-inflammatory and neutrophil-mobilizing cytokines and chemokines; Right panel: IL-17–NOTCH pathway. In the OPC-astrocyte co-culture system, IL-17 stimulation induces NOTCH1 activation in the OPCs, resulting in inflammatory gene expression accompanied by enhanced cell proliferation and impaired maturation. IL-17 receptor A (IL-17RA) can directly interact with the NOTCH receptor NOTCH1, leading to the cleavage of the NICD. Furthermore, Act1, the adaptor protein for IL-17 signalling, forms a complex with NICD in response to IL-17 stimulation. The Act1–NICD complex translocates into the nucleus where Act1–NICD and transcription factor RBP-J are recruited to the promoters of NOTCH target genes important for inflammation and cell proliferation.

References

    1. International Multiple Sclerosis Genetics C. et al. Genetic risk and a primary role for cell-mediated immune mechanisms in multiple sclerosis. Nature 476, 214–219 (2011). - PMC - PubMed
    1. Becher B., Bechmann I. & Greter M. Antigen presentation in autoimmunity and CNS inflammation: how T lymphocytes recognize the brain. J. Mol. Med. 84, 532–543 (2006). - PubMed
    1. Bar-Or A. Immunology of multiple sclerosis. Neurol. Clin. 23, 149–175 (2005). - PubMed
    1. Steinman L. Multiple sclerosis: a two-stage disease. Nat. Immunol. 2, 762–764 (2001). - PubMed
    1. Stromnes I. M. & Goverman J. M. Active induction of experimental allergic encephalomyelitis. Nat. Protoc. 1, 1810–1819 (2006). - PubMed

Publication types

MeSH terms

Substances