. 2017 May 31:8:15657.
doi: 10.1038/ncomms15657.

Cancer-cell intrinsic gene expression signatures overcome intratumoural heterogeneity bias in colorectal cancer patient classification

Affiliations

Cancer-cell intrinsic gene expression signatures overcome intratumoural heterogeneity bias in colorectal cancer patient classification

Philip D Dunne et al. Nat Commun. .

Abstract

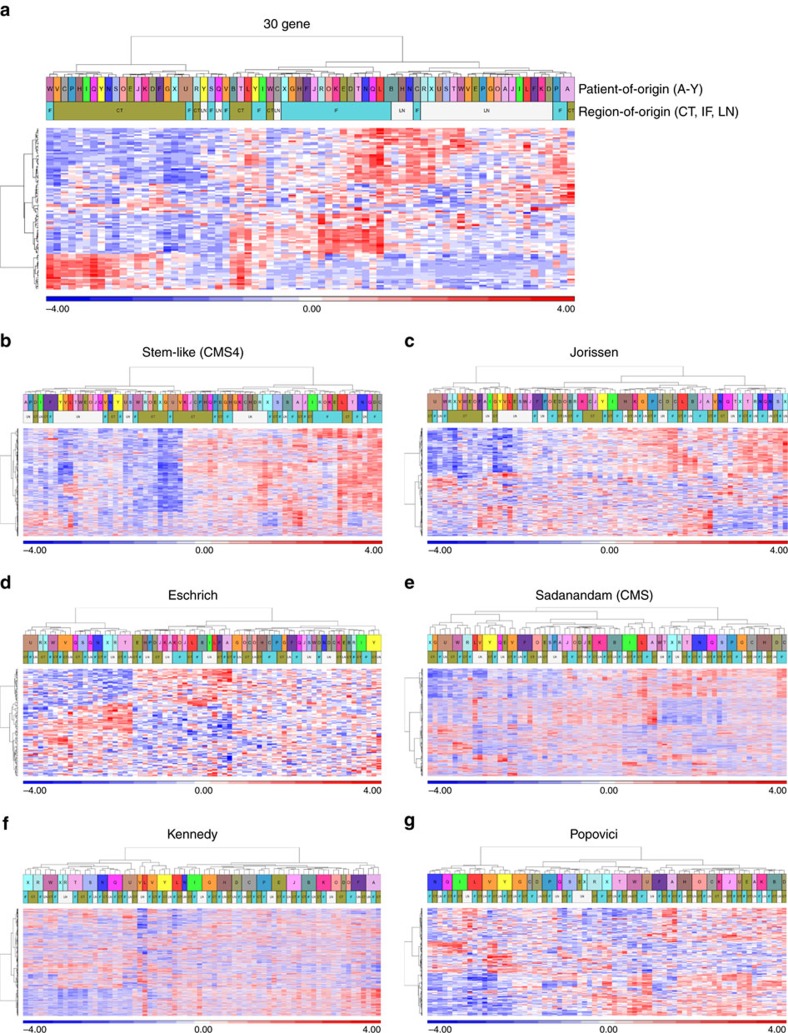
Stromal-derived intratumoural heterogeneity (ITH) has been shown to undermine molecular stratification of patients into appropriate prognostic/predictive subgroups. Here, using several clinically relevant colorectal cancer (CRC) gene expression signatures, we assessed the susceptibility of these signatures to the confounding effects of ITH using gene expression microarray data obtained from multiple tumour regions of a cohort of 24 patients, including central tumour, the tumour invasive front and lymph node metastasis. Sample clustering alongside correlative assessment revealed variation in the ability of each signature to cluster samples according to patient-of-origin rather than region-of-origin within the multi-region dataset. Signatures focused on cancer-cell intrinsic gene expression were found to produce more clinically useful, patient-centred classifiers, as exemplified by the CRC intrinsic signature (CRIS), which robustly clustered samples by patient-of-origin rather than region-of-origin. These findings highlight the potential of cancer-cell intrinsic signatures to reliably stratify CRC patients by minimising the confounding effects of stromal-derived ITH.


Conflict of interest statement

P.G.J.: Previous Founder and Shareholder of Almac Diagnostics; CV6 Therapeutics: Expert Advisor and Shareholder; Chugai Pharmaceuticals: Consultant. The remaining authors declare no competing financial interests.

Figures

Figure 1
Figure 1. Variation in the ability of gene expression signatures to concordantly cluster multi-region samples according to patient-of-origin.
(a) Random Forest (RF) classifier scores specifically for CMS1-4 individually in the patient-matched samples. RF scores for each patient were normalized to the CT sample (CT=1 for all patients) and IF scores were plotted relative to this. Patients are labelled alphabetically (A-Y) and colour coded according to each individual CMS analysis for visualization (Yellow=CMS1, Blue=CMS2, Pink=CMS3, Green=CMS4). (b) Overview of the multi-region samples used in the analysis. Detailed information on each signature is outlined in the Methods section. Briefly, the 30 gene signature was developed as a classifier of region-of-origin in this dataset and can stratify samples into CT or IF regional groups. The Sadanandam signature is a surrogate marker of the CMS classifier and the stem-like signature is a sub-classifier within the Sadanandam signature specifically for the CMS4 subtype. The Jorissen, Eschrich and Kennedy signatures are stage II/III prognostic CRC classifiers. The Popovici signature classifies stage II/III CRC according to similarity to a BRAF mutant transcriptional classifier. (c) Divisive clustering methodology (DIANA) highlights the potential of each individual gene expression signature to correctly cluster multi-region primary tumour samples according to the patient-of-origin. Patients are labelled alphabetically (A–Y) and colour coded for visualization. (d) Table of concordantly clustered patient samples according to each signature. CT, central tumour; IF, invasive front.
Figure 2
Figure 2. Assessment of multi-regional sample clustering using primary and matched metastatic tissue.
(ag). Hierarchical clustering of our extended patient cohort, including CT, IF and LN tumour tissue, based on semi-supervised expression profiles of genes from the previously published 30 gene signature (a) and each individual independent gene signature, namely the stem-like (CMS4) (b), Jorissen (c), Eschrich (d), Sadanandam (CMS) (e), Kennedy (f) and Popovici (g) signatures. Top overlay bar represents colour coded patient-of -origin, labelled A–Y, with the bottom overlay bar representing region-of-origin, CT, green; IF, blue; LN, white.
Figure 3
Figure 3. A higher proportion of epithelial transcripts enables concordant clustering of patient tumour samples regardless of region-of-origin.
(a) Dot plots using normalized Pearson similarity scores for each individual gene expression signature as indicated. Error bars on dot plots represent s.d. values, with median bar. The colour label key for each signature is indicated on the right of this plot. (b) Median expression of all probesets annotated to the genes according to the cell-specific source of the transcripts in the 30 gene, stem-like (CMS4), Jorissen, Eschrich, Sadanandam (CMS) and Kennedy signatures using epithelial, fibroblast, endothelial, and leukocyte populations isolated by FACS (GSE39396). (c) Median expression of all probesets annotated to the genes according to the cell-specific source of the transcripts in the Popovici signature using epithelial, fibroblast, endothelial, and leukocyte populations isolated by FACS (GSE39396).
Figure 4
Figure 4. The CRC intrinsic signature (CRIS) enables concordant clustering of patient tumour samples regardless of region-of-origin.
(a) Median expression of all probesets annotated to the genes according to the cell-specific source of the transcripts in the CRIS signature using epithelial, fibroblast, endothelial, and leukocyte populations isolated by FACS (GSE39396). (b) DIANA clustering of CT and IF patient samples based on the gene expression of the CRIS signature. (c) Table of concordantly clustered patient samples (as in Fig. 1d) now including the CRIS signature. (d) Hierarchical clustering of our extended patient cohort, including CT, IF and LN tumour tissue, based on semi-supervised expression profiles of CRIS signature genes. Top overlay bar indicates patients, bottom overlay bar indicated region-of-origin. (e) Table of concordantly clustered patient samples using either the CMS Random-forest (RF) classifier or the CRIS Nearest Template Predictor (NTP) classifier. (f) Caleydo (StratomeX) graphical representation of the highest predicted CMS score (CMS1-4, UNK=Unknown assignment) and CRIS subtype (CRIS-A-E) for each sample according to region-of-origin. Concordant subtype assignment of samples is indicated by orange coloured linker, discordant subtype assignment of samples is indicated by grey coloured linker.
Figure 5
Figure 5. Assessment of multi-region sample clustering into concordant subtypes and into individual patient clusters.
(a) Dot plots using normalized Pearson similarity scores for each individual gene expression signature (as in Fig. 3a) now including the CRIS signature. Error bars on dot plots represent s.d. values, with median bar. (b) Patient group overall ratio plot demonstrating the ability of each individual signature to concordantly cluster patient samples as an indication of confounding transcriptional ITH. For example, the 30 gene signature displays an immediate drop in concordant sample clustering, indicating high levels of confounding transcriptional ITH. The CRIS signature maintains a high level of concordant clustering at both the initial subtype, (left of x axis), and continues to cluster samples according to each individual patient, (right of x axis). The proportion of patients with all samples in the same cluster is measured on the y axis from 1 to 0, relative to the number of clusters on the x axis from 2 to 24. Each continuous signature score is colour coded as outlined in the legend and in the colour label key.

References

    1. Sorlie T. et al.. Gene expression patterns of breast carcinomas distinguish tumor subclasses with clinical implications. Proc. Natl Acad. Sci. USA 98, 10869–10874 (2001). - PMC - PubMed
    1. Perou C. M. et al.. Molecular portraits of human breast tumours. Nature 406, 747–752 (2000). - PubMed
    1. Kern S. E. Why your new cancer biomarker may never work: recurrent patterns and remarkable diversity in biomarker failures. Cancer Res. 72, 6097–6101 (2012). - PMC - PubMed
    1. Sanz-Pamplona R. et al.. Clinical value of prognosis gene expression signatures in colorectal cancer: a systematic review. PLoS ONE 7, e48877 (2012). - PMC - PubMed
    1. Burrell R. A., McGranahan N., Bartek J. & Swanton C. The causes and consequences of genetic heterogeneity in cancer evolution. Nature 501, 338–345 (2013). - PubMed

Publication types

Substances