. 2017 May 31:8:15107.
doi: 10.1038/ncomms15107.

Selective analysis of cancer-cell intrinsic transcriptional traits defines novel clinically relevant subtypes of colorectal cancer

Affiliations

Selective analysis of cancer-cell intrinsic transcriptional traits defines novel clinically relevant subtypes of colorectal cancer

Claudio Isella et al. Nat Commun. .

Abstract

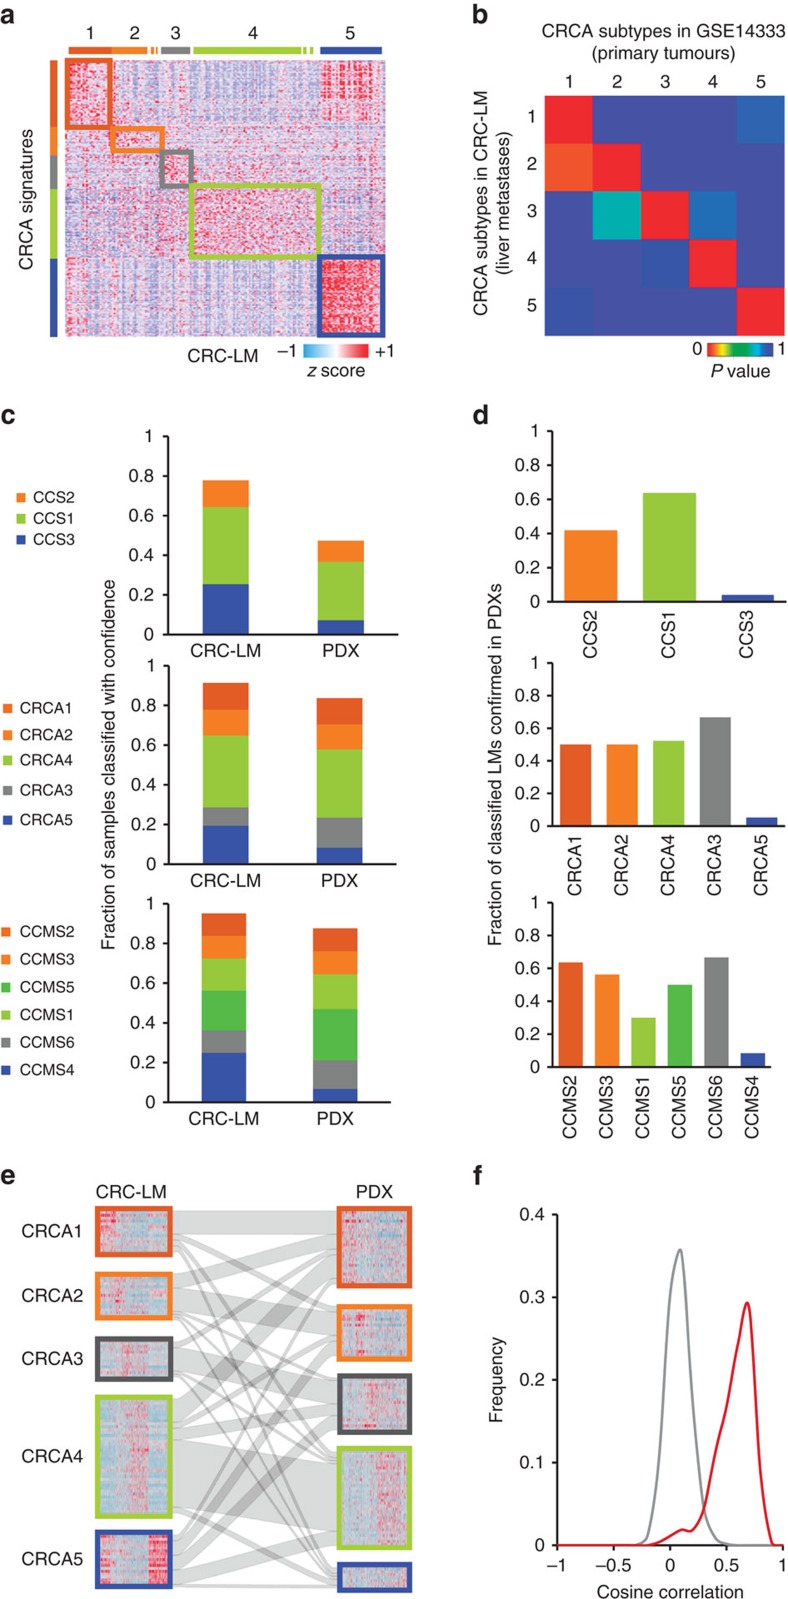
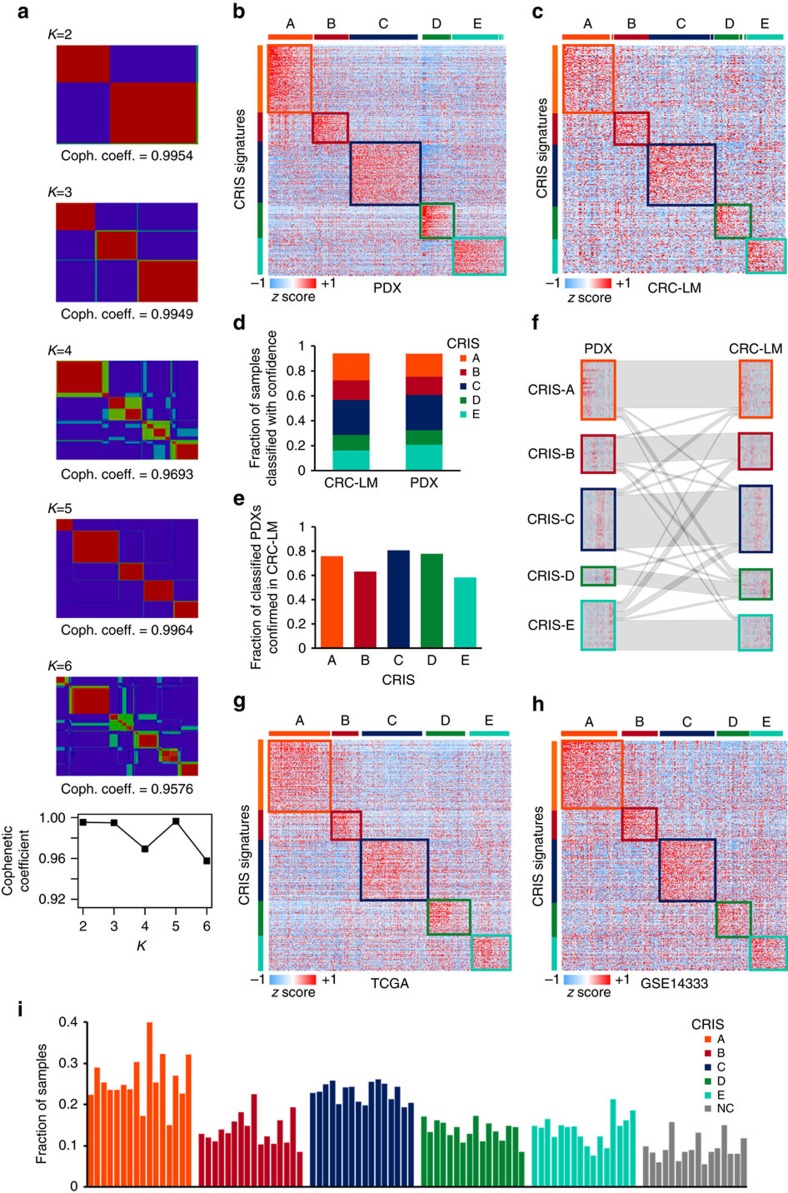
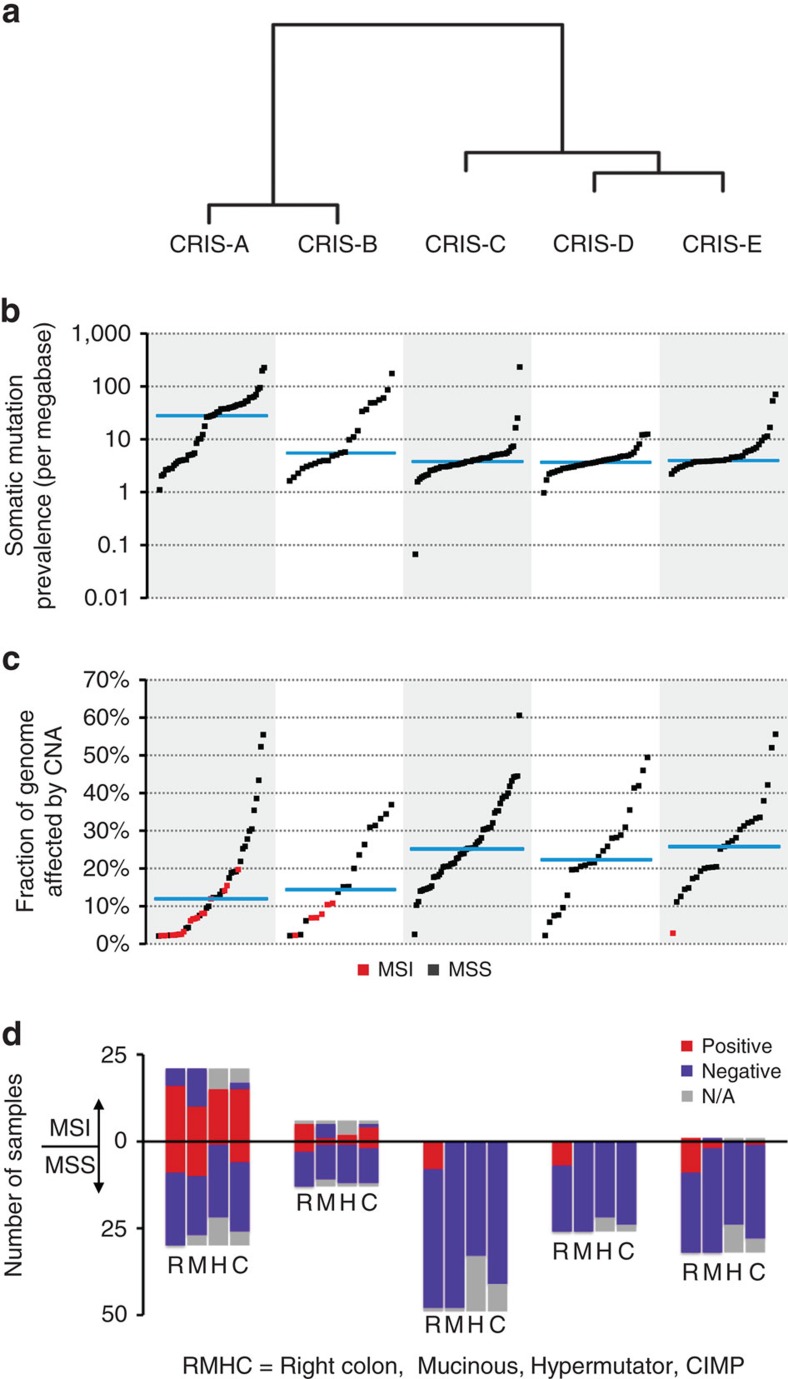
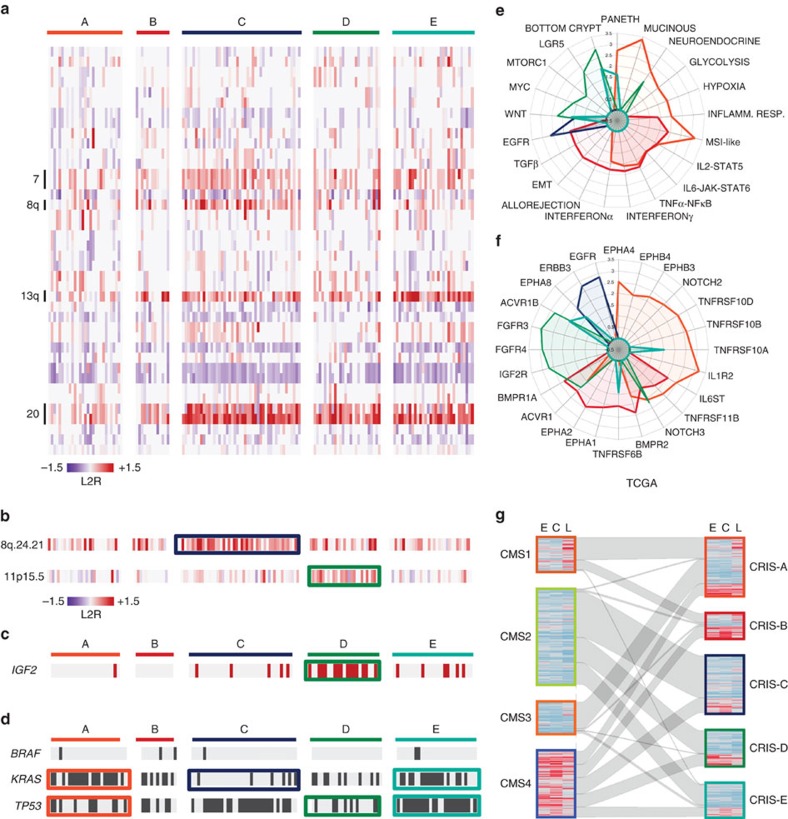
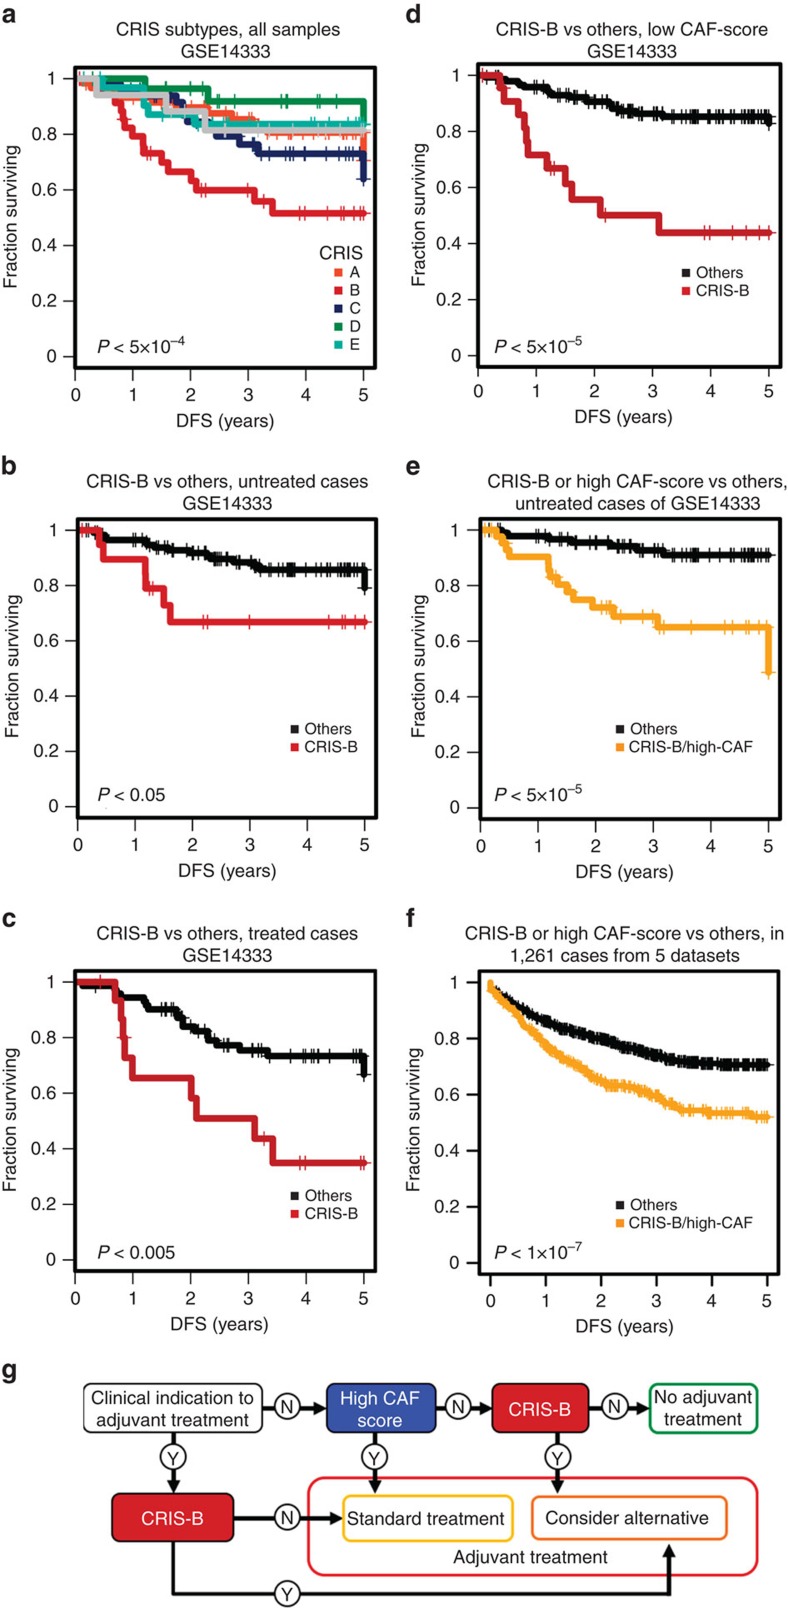
Stromal content heavily impacts the transcriptional classification of colorectal cancer (CRC), with clinical and biological implications. Lineage-dependent stromal transcriptional components could therefore dominate over more subtle expression traits inherent to cancer cells. Since in patient-derived xenografts (PDXs) stromal cells of the human tumour are substituted by murine counterparts, here we deploy human-specific expression profiling of CRC PDXs to assess cancer-cell intrinsic transcriptional features. Through this approach, we identify five CRC intrinsic subtypes (CRIS) endowed with distinctive molecular, functional and phenotypic peculiarities: (i) CRIS-A: mucinous, glycolytic, enriched for microsatellite instability or KRAS mutations; (ii) CRIS-B: TGF-β pathway activity, epithelial-mesenchymal transition, poor prognosis; (iii) CRIS-C: elevated EGFR signalling, sensitivity to EGFR inhibitors; (iv) CRIS-D: WNT activation, IGF2 gene overexpression and amplification; and (v) CRIS-E: Paneth cell-like phenotype, TP53 mutations. CRIS subtypes successfully categorize independent sets of primary and metastatic CRCs, with limited overlap on existing transcriptional classes and unprecedented predictive and prognostic performances.


Conflict of interest statement

The authors declare no competing financial interests.

Figures

Figure 1
Figure 1. CRC PDXs fail assignment to public transcriptional subtypes.
(a) Heatmap showing NTP classification of the CRC-LM data set based on the signatures of the CRCA classification system. (b) Submap analysis of CRCA subtype similarity between CRC liver metastases (CRC-LM) and primary tumours (GSE14333). P values are calculated by Fisher’s exact test using the Submap tool available from Gene Pattern. (c) Column chart showing the fractions of CRC liver metastases (CRC-LM), or their corresponding PDXs, which were confidently assigned (NTP, FDR<0.2) to the subtypes of three different public classifiers. (d) Fraction of PDXs assigned to the same class of their corresponding liver metastasis according to the three classifiers (as in c). (e) Caleydo view of correspondences between the CRCA class assignments of CRC-LM samples and those of their PDX counterparts. (f) Distribution of Pearson’s correlation values obtained by analysing unmatched (grey line) and matched (red line) CRC-LM/PDX pairs.
Figure 2
Figure 2. CRIS classifies both CRC tumours and PDXs based on cancer-cell intrinsic transcriptional traits.
(a) NMF-based consensus clustering of the PDX data set and plot of cophenetic coefficients for K=2–6. (b,c) Heatmap showing NTP-based CRIS classification of the PDX (b) and the CRC-LM (c) data sets. (d) Column chart showing the fractions of CRC-LMs and PDXs that were confidently classified (FDR<0.2) by CRIS; coloured sub-columns represent the relative distribution of subtypes within each data set. (e) Column chart showing, for each CRIS subtype, the fractions of samples for which CRC-LMs and their corresponding PDXs were confidently assigned (FDR<0.2) to the same class. (f) Caleydo view of CRIS correspondences between CRC-LM samples and their PDX counterparts. (g,h) Heatmaps showing CRIS classification of primary tumours based on RNAseq data from the TCGA (g) and Affymetrix microarray data of the GSE14333 data set (h). (i) Column chart showing the distribution of CRIS subtypes based on NTP classification across 16 independent CRC data sets (Supplementary Data 11); NC (non-classified) indicates samples for which NTP could not confidently assign any of the subtypes (FDR>0.2).
Figure 3
Figure 3. Molecular and phenotypic characteristics of CRIS subtypes in the TCGA data set.
(a) Clustering of CRIS classes based on similarity of the distances, as calculated by NTP, when classifying the TCGA data set. (b) Frequency of somatic single-nucleotide variations. Individual samples are represented as black dots; the mean of each CRIS subtype is plotted in light blue. (c) Extent of somatic copy number alterations. Samples are represented as red or black dots to denote MSI or MSS tumours, respectively; the mean of each CRIS subtype is plotted in light blue. (d) Distribution of the indicated phenotypic and genetic characteristics of CRC samples across CRIS subtypes.
Figure 4
Figure 4. Genetic and functional features of CRIS classes in MSS colorectal cancer.
(a) Heatmap showing the distribution of broad copy number changes displaying the top-five highest average variations in individual CRIS subtypes in MSS samples of the TCGA data set. (b) Heatmap showing selected focal amplifications in MSS samples of the TCGA data set. Significant subtype enrichments are marked by coloured boxes. (c) Distribution of cases overexpressing IGF2 according to the TCGA data set. (d) Distribution of sequence alterations in BRAF, KRAS and TP53 in MSS samples extracted from the TCGA data set. Significant subtype enrichments are marked by coloured boxes. For enrichment analysis, P<0.05 by Fisher’s exact test was considered significant. (e) Radar plot showing phenotypic and functional characteristics of CRIS subtypes, expressed as normalized enrichment scores (NESs) calculated by GSEA. (f) Radar plot showing autocrine stimulation loops in CRIS subtypes, expressed as NESs and calculated based on gene expression analysis of ligand-receptor pairs. (g) Caleydo view of correspondences between CMS subtypes and CRIS classes in the TCGA data set. Heatmaps show estimates of stromal infiltration derived from gene expression analysis of specific signatures (C, CAFs; E, endothelial cells; L, leukocytes).
Figure 5
Figure 5. CRIS-C and EGFR pathway activity predict cetuximab sensitivity.
(a) Prevalence of CRIS classes among PDX cases scored as sensitive or resistant to cetuximab. (b) Bar-of-pie charts showing the distribution of validated resistance biomarkers (KRAS mutations in codons 12 and 13) and proposed resistance biomarkers (other resistance markers; for their enumeration, see Supplementary Data 4) in PDXs (pies). The fraction of sensitive or resistant cases specifically in the PDX subpopulation that does not harbour resistance biomarkers is shown in the bars. The analysis encompasses the whole PDX data set, CRIS-C alone, and all other CRIS classes. (c) Bar-of-pie chart showing the distribution of CRIS subtypes in KRAS wild-type cases of GSE5851, a data set of CRC liver metastases annotated for clinical response to cetuximab monotherapy (pie). Bars denote the fraction of tumours responsive or resistant to cetuximab within CRIS-C or in all other CRIS classes. (d) Average expression of the gene set indicative of EGFR pathway activity in samples assigned to CRIS-C versus samples assigned to all other CRIS classes; error bars represent s.d. from the mean; statistical significance was calculated by Wilcoxon rank-sum test. (e) Heatmap showing response to cetuximab, average expression of the gene set indicative of EGFR pathway activity, and expression of individual genes of the EGFR pathway activity gene set across CRIS classes. The analysis includes PDXs that do not harbour known genetic markers of resistance.
Figure 6
Figure 6. CRIS subtypes predict CRC prognosis independent of clinical stage and stromal infiltration.
(a) Kaplan–Meier plot of DFS of CRIS subtypes in GSE14333, a prognostically annotated CRC gene expression data set. (be) Kaplan–Meier plot comparing the DFS of CRIS-B patients versus that of all other patients in cases who did not (b) or did receive (c) adjuvant chemotherapy and in cases with low (d) CAF infiltration. (e,f) Kaplan–Meier plot comparing the DFS of cases with high CAF infiltration or CRIS-B membership versus that of all other patients in the untreated population (n=138) of GSE14333 (e) and in 1,261 unselected cases extracted from six independent data sets (f). (g) Flowchart summarizing a possible decision tree taking into account CRIS-B membership and high CAF infiltration, together with the clinical indication to adjuvant treatment, to refine the therapeutic decisional process after surgery.

References

    1. Sadanandam A. et al.. A colorectal cancer classification system that associates cellular phenotype and responses to therapy. Nat. Med. 19, 619–625 (2013). - PMC - PubMed
    1. De Sousa E Melo F. et al.. Poor-prognosis colon cancer is defined by a molecularly distinct subtype and develops from serrated precursor lesions. Nat. Med. 19, 614–618 (2013). - PubMed
    1. Marisa L. et al.. Gene expression classification of colon cancer into molecular subtypes: characterization, validation, and prognostic value. PLoS Med. 10, e1001453 (2013). - PMC - PubMed
    1. Roepman P. et al.. Colorectal cancer intrinsic subtypes predict chemotherapy benefit, deficient mismatch repair and epithelial-to-mesenchymal transition. Int. J. Cancer 134, 552–562 (2014). - PMC - PubMed
    1. Budinska E. et al.. Gene expression patterns unveil a new level of molecular heterogeneity in colorectal cancer. J. Pathol. 231, 63–76 (2013). - PMC - PubMed

Publication types

MeSH terms