. 2017 May 31:8:15331.
doi: 10.1038/ncomms15331.

Beat frequency quartz-enhanced photoacoustic spectroscopy for fast and calibration-free continuous trace-gas monitoring

Affiliations

Beat frequency quartz-enhanced photoacoustic spectroscopy for fast and calibration-free continuous trace-gas monitoring

Hongpeng Wu et al. Nat Commun. .

Abstract

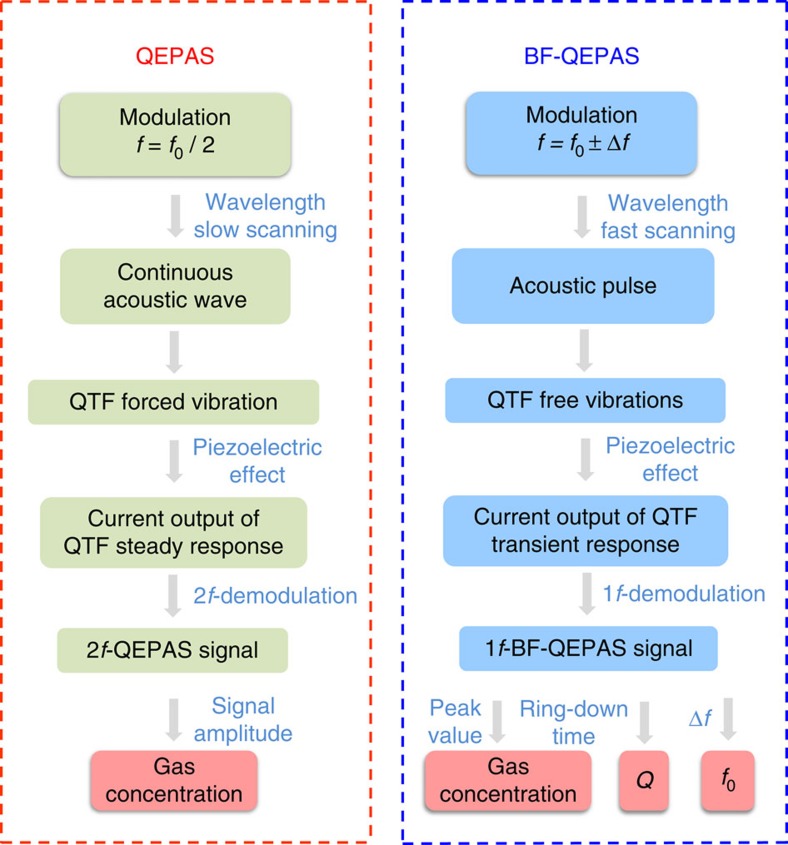
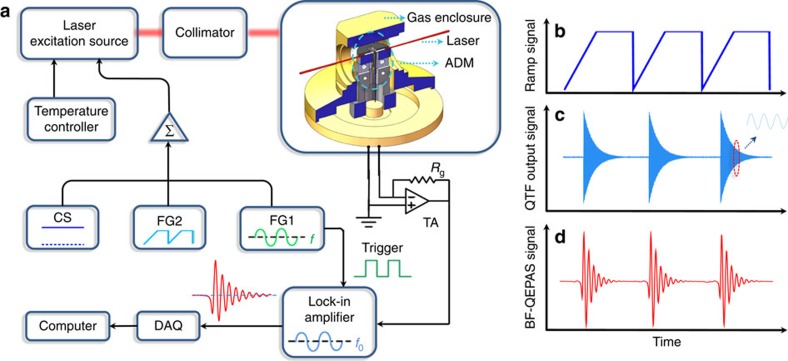
Quartz-enhanced photoacoustic spectroscopy (QEPAS) is a sensitive gas detection technique which requires frequent calibration and has a long response time. Here we report beat frequency (BF) QEPAS that can be used for ultra-sensitive calibration-free trace-gas detection and fast spectral scan applications. The resonance frequency and Q-factor of the quartz tuning fork (QTF) as well as the trace-gas concentration can be obtained simultaneously by detecting the beat frequency signal generated when the transient response signal of the QTF is demodulated at its non-resonance frequency. Hence, BF-QEPAS avoids a calibration process and permits continuous monitoring of a targeted trace gas. Three semiconductor lasers were selected as the excitation source to verify the performance of the BF-QEPAS technique. The BF-QEPAS method is capable of measuring lower trace-gas concentration levels with shorter averaging times as compared to conventional PAS and QEPAS techniques and determines the electrical QTF parameters precisely.


Conflict of interest statement

The authors declare no competing financial interests.

Figures

Figure 1
Figure 1. A side-by-side comparison of conventional QEPAS and BF-QEPAS techniques.
Unlike conventional QEPAS, the modulation frequency f of the laser in the BF-QEPAS technique is shifted from the QTF resonance frequency f0. The laser wavelength is rapidly scanned with respect to the QTF response time. By analyzing the beat signal generated between the laser modulation frequency and the QTF resonance frequency, a BF-QEPAS-based sensor can determine the target gas concentration, the QTF resonance frequency and the Q-factor in a single measurement.
Figure 2
Figure 2. Schematic of the experimental BF-QEPAS apparatus.
(a) The diode laser was operated by means of a current and temperature controller. A direct current (d.c.), alternating current (a.c.) and ramp signal provided by current source, function generator 1 (FG1) and function generator 2 (FG2), respectively, were used as the laser drive current, modulation current and scanning current, respectively. Three different semiconductor lasers, DFB-DL, DFB quantum cascade laser (DFB-QCL) and DFB interband cascade laser (DFB-ICL), were employed in this system as the excitation sources sequentially. A fibre-coupled collimator ensures that the collimated DFB-DL beam passes through the ADM without touching the QTF prongs. Optical lenses were used to collimate the DFB-ICL and DFB-QCL laser beams. The details about the experiments, in which the DFB-QCL and DFB-ICL were equipped as the excitation source, were described in the Supplementary Figs 6 and 7, respectively. DAQ, data acquisition; TA, transimpedance amplifier. (b) The ramp signal provided by FG2. (c) The output signal generated by the piezoelectric effect of the QTF after its prongs were excited by an acoustic pulse. (d) The BF signal generated after the piezoelectric signal was demodulated by a LIA.
Figure 3
Figure 3. Simulation and experimental results of BF-QEPAS.
(ac) First harmonic QTF output signal for different modulation frequencies and wavelength-scanning rates were simulated by MATLAB software with actual parameters of the QTF system. The different wavelength-scanning rates can be simulated by changing the value of ta as this parameter represents the action time of the acoustic force to the QTF. The value of ta was estimated by using the ratio of the absorption line width to the wavelength scanning rate. (df) The corresponding tests were carried out with 2.5% water vapour at room temperature and atmosphere pressure. The wavelength was scanned at a rate of 0.12 cm−1 s−1, 3 cm−1 s−1 and 72 cm−1 s−1, respectively by scanning the laser current. (a,b,d,e) The modulation frequency of the laser current was 32,760 Hz, while for c,f it was 32,960 Hz.
Figure 4
Figure 4. Standard first three harmonics and corresponding BF signals obtained with the conventional QEPAS and BF-QEPAS techniques.
(ac) The wavelength-scanning rate of the diode laser, the time constant and filter slope of the LIA for conventional QEPAS technique were 0.12 cm−1 s−1, 300 ms and 12 dB (corresponding to a detection bandwidth of 0.417 Hz). (df) The same parameters were 36 cm−1 s−1, 100 μs and 12 dB (corresponding to a detection bandwidth of 1,250 Hz) for the BF-QEPAS technique. The laser modulation frequencies for standard first (a), second (b) and third (c) harmonic were 32,760, 16,380 and 10,920 Hz, while they were 32,640, 16,320 and 10,880 Hz for the corresponding BF signals (df), respectively.
Figure 5
Figure 5. Qualitative representation of the QTF response curves.
(a) Red curve represents fits to the experimental data acquired via the BF-QEPAS technique, while the blue lines are fits to the peak value of the 2f signal generated by the conventional QEPAS technique. Both conventional QEPAS and BF-QEPAS signals are symmetrical and centred on the resonance frequency of the QTF. However, their maximum positions differ. The conventional QEPAS signal shows a Lorentzian-like behaviour. As a result, its maximum position is located at the resonance frequency of the QTF. The BF-QEPAS signal curve presents a two winged shape so that two maximum positions appear on both sides of the resonance frequency. (b) The amplitude of the beat signal as a function of the modulation depth (MD) current. The variation trend of the beat signal with the modulation depth increasing shows a similar behaviour as the conventional wavelength modulation technique. The signal amplitude rises when the modulation depth current is <29 mA. After reaching the maximum, the signal amplitude starts to decrease.
Figure 6
Figure 6. Linear dependence of the BF-QEPAS signal on H2O concentration levels.
The 1f-based BF-QEPAS signal was recorded as the H2O concentration levels were varied. For each concentration step, 50 readings of the BF-QEPAS signal were averaged to increase the accuracy of the result. The data was plotted as a function of H2O concentration, which confirms the linearity of the BF-QEPAS response to concentration.
Figure 7
Figure 7. Allan–Werle deviation plot as a function of averaging time.
The background noise of the BF-QEPAS-based sensor was measured when the ADM was filled with pure N2. The LIA time constant and filter slope as well as the wavelength-scanning rate of the diode laser were set to optimized parameters, 100 μs, 12 dB and 36 cm−1 s−1, respectively.

References

    1. Anthony K. W. et al.. Methane emissions proportional to permafrost carbon thawed in Arctic lakes since the 1950s. Nat. Geosci. 9, 679–682 (2016).
    1. Jin W., Cao Y., Yang F. & Ho H. L. Ultra-sensitive all-fibre photothermal spectroscopy with large dynamic range. Nat. Commun. 6, 7767 (2015). - PMC - PubMed
    1. Royer S. J. et al.. A high-resolution time-depth view of dimethylsulphide cycling in the surface sea. Sci. Rep. 5, 17729 (2015). - PMC - PubMed
    1. Ren W., Jiang W. & Tittel F. K. Single-QCL-based absorption sensor for simultaneous trace-gas detection of CH4 and N2O. Appl. Phys. B 117, 245–251 (2014).
    1. Kosterev A. A., Bakhirkin Y. A., Curl R. F. & Tittel F. K. Quartz-enhanced photoacoustic spectroscopy. Opt. Lett. 27, 1902–1904 (2002). - PubMed

Publication types