. 2017 Sep;10(5):366-379.
doi: 10.1111/cts.12472. Epub 2017 May 31.

New Paradigm for Translational Modeling to Predict Long-term Tuberculosis Treatment Response

Affiliations

New Paradigm for Translational Modeling to Predict Long-term Tuberculosis Treatment Response

I H Bartelink et al. Clin Transl Sci. 2017 Sep.

Abstract

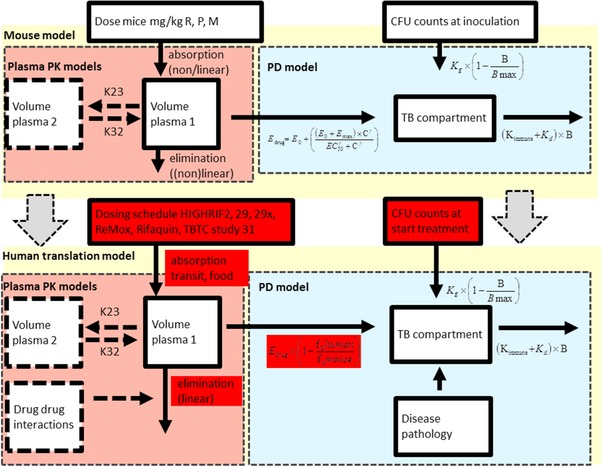
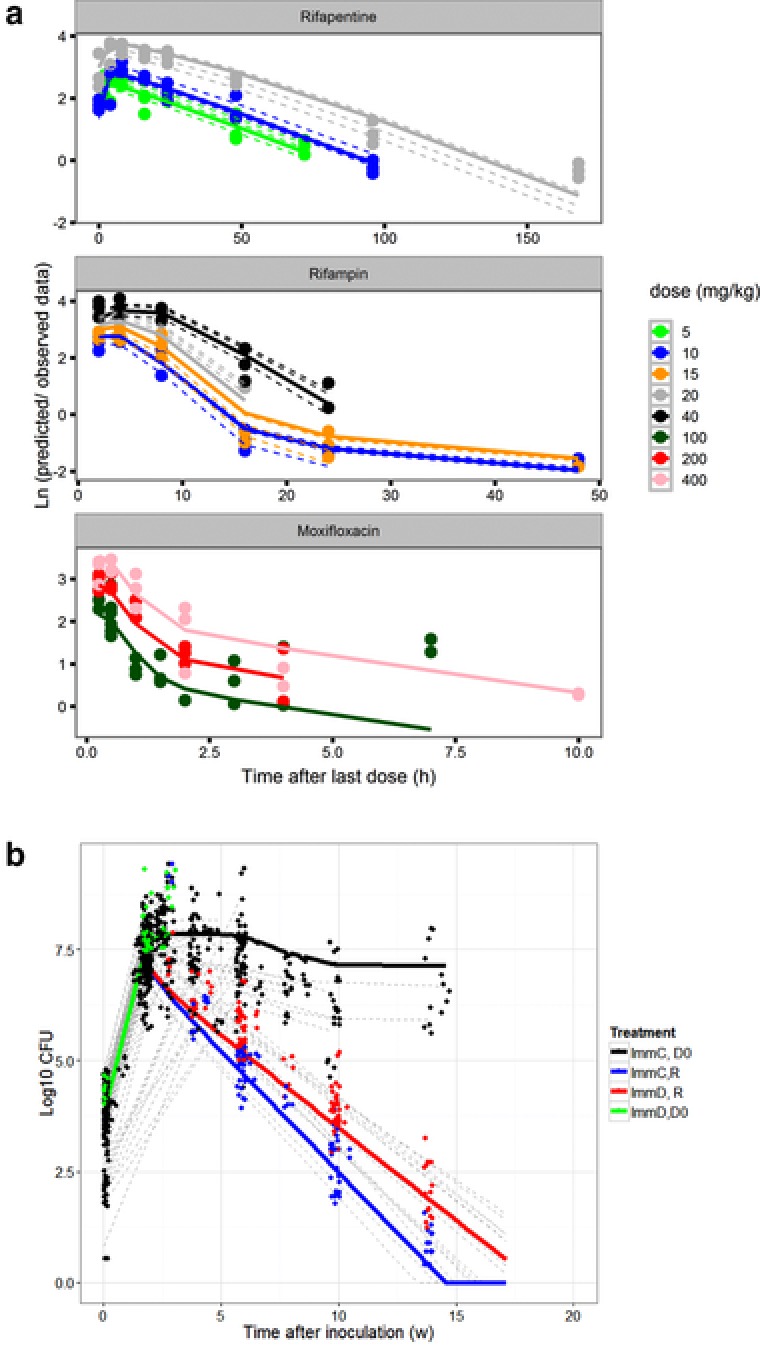
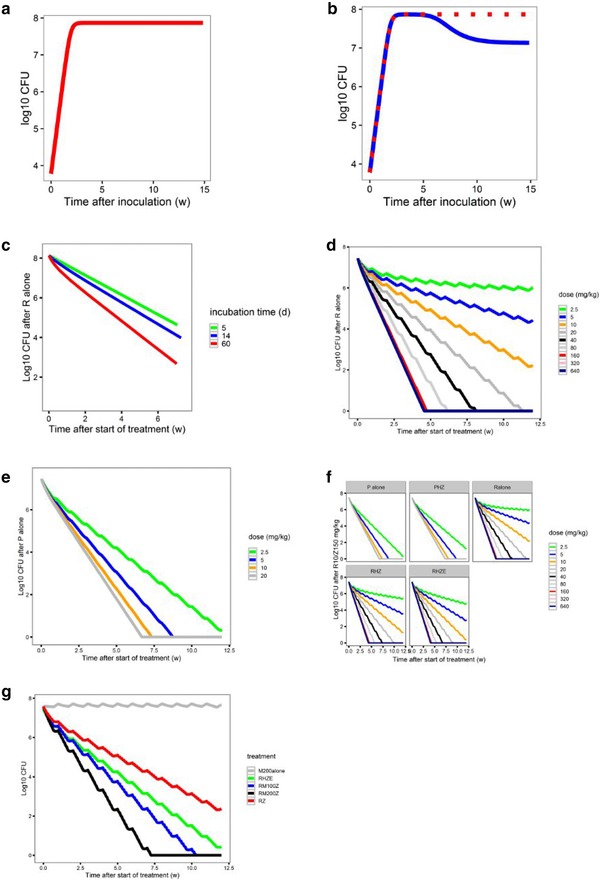
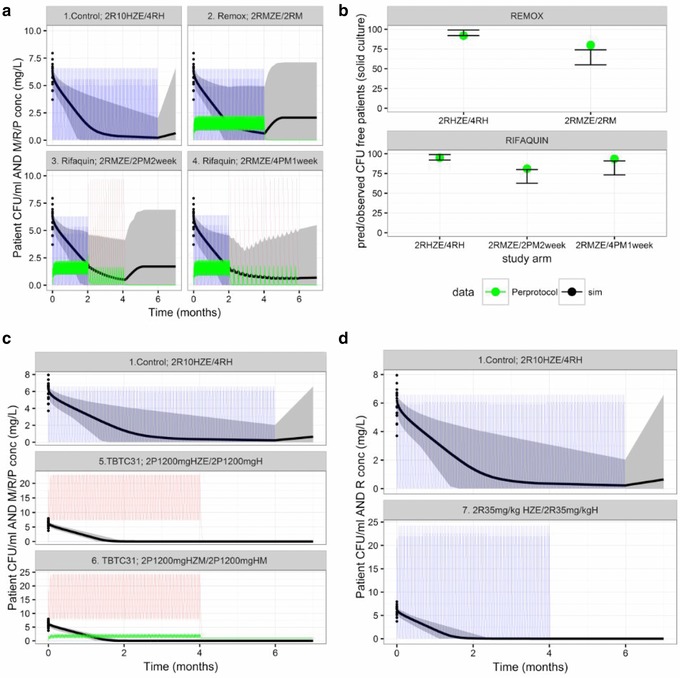
Disappointing results of recent tuberculosis chemotherapy trials suggest that knowledge gained from preclinical investigations was not utilized to maximal effect. A mouse-to-human translational pharmacokinetics (PKs) - pharmacodynamics (PDs) model built on a rich mouse database may improve clinical trial outcome predictions. The model included Mycobacterium tuberculosis growth function in mice, adaptive immune response effect on bacterial growth, relationships among moxifloxacin, rifapentine, and rifampin concentrations accelerating bacterial death, clinical PK data, species-specific protein binding, drug-drug interactions, and patient-specific pathology. Simulations of recent trials testing 4-month regimens predicted 65% (95% confidence interval [CI], 55-74) relapse-free patients vs. 80% observed in the REMox-TB trial, and 79% (95% CI, 72-87) vs. 82% observed in the Rifaquin trial. Simulation of 6-month regimens predicted 97% (95% CI, 93-99) vs. 92% and 95% observed in 2RHZE/4RH control arms, and 100% predicted and observed in the 35 mg/kg rifampin arm of PanACEA MAMS. These results suggest that the model can inform regimen optimization and predict outcomes of ongoing trials.


Figures

Figure 1
Figure 1
A translational pharmacokinetic/pharmacodynamic (PK/PD) model derived from mouse data used to predict colony forming unit (CFU) counts in patients. In this translational model, we assumed the following characteristics: (i) that the rate of bacterial growth in BALB/c mice and in human patients with drug‐sensitive pulmonary tuberculosis (TB) are the same, and (ii) that the concentration‐response relationship in mice and human patients at the site of action is the same. Therefore, the parameters assumed to be equivalent to the preclinical values are not highlighted, whereas the patient‐based parameters are highlighted in red. Baseline, number of bacteria at inoculation; Bmax, maximum number of bacteria; γ, the sigmoidicity factor, which defines the shape of the relationship; γimmune response, the sigmoidicity factor, which defines the shape of the immune system – bacterial effect relationship; IT50, the time that produces 50% of the maximum immune effect; Kdeath, bacterial death constant; Kgrowth, bacterial growth constant; M, moxifloxacin; P, rifapentine; R, rifampin; θKDOI.0, immune killing rate in treated animals at average incubation time; θKDOI.t, the increase in killing rate in experiments with a longer than average incubation period; θKIND, the maximum immune dependent killing rate in untreated animals; EC50, the antibiotic concentration that produces 50% of the maximum effect; Edrug, effect with a certain drug treatment; Emax, the maximal achievable effect with a certain drug treatment.
Figure 2
Figure 2
(a) Observed and model‐predicted concentrations of moxifloxacin, rifapentine and rifampin per dose level (in mg/kg). Solid lines are population predicted values, dotted lines are individual predicted values (no inter‐individual variability could be estimated in the moxifloxacin model) and dots are the observed data. (b) Observed and model‐predicted colony forming unit (CFU) counts of several components of the pharmacokinetic/pharmacodynamic (PK/PD) data and model: CFU counts in untreated immune competent (black) and immune deficient (green) mice and the effect of treatment with rifampin 10 mg/kg, isoniazid 10 mg/kg, and pyrazinamide 150 mg/kg in immune competent (blue) and immune deficient (red) mice. Solid lines are population predicted values, dotted gray lines are individual predicted trial results (in which variability in baseline and Bmax was included and dots are the observed data.
Figure 3
Figure 3
Components of the pharmacokinetic/pharmacodynamic (PK/PD) model. (a) Baseline model of bacterial growth in mice without immune function (red). (b) Bacterial growth in untreated mice is dependent on the immune competency (immune‐competent BALB/c mice, blue; immune‐deficient nude mice, red). (c) The additive effect of immune function on the killing effect of rifampin (R) alone is smaller in acute infection models (5‐day [green] or 14‐day [blue] incubation period prior to treatment onset [time 0]) compared with a chronic infection model (61‐day incubation period (red). Simulation of the concentration‐colony forming unit (CFU) count relationship of (d) rifampin alone, or (e) rifapentine (P) alone, at different dose levels tested in the mouse model. (f) The effect of combining R or P with isoniazid (H) 25 mg/kg and pyrazinamide (Z) 150 mg/kg ± E 100 mg/kg in immune‐competent mice. (g) The estimated effect of moxifloxacin in combination with R10 mg/kg and Z 150 mg/kg and predicted effect of moxifloxacin alone*. E, ethambutol; M, moxifloxacin. *Moxifloxacin alone simulations alone effect was based on the difference in effect between rifampin/ pyrazinamide and rifampin/moxifloxacin/pyrazinamide.
Figure 4
Figure 4
Pharmacokinetic/pharmacodynamic (PK/PD) simulations of patient outcomes in trial scenarios. (a) Simulated sputum colony forming unit (CFU) counts and drug concentrations in patients receiving treatment with the control regimen or moxifloxacin 400 mg in combination with pyrazinamide, ethambutol, and either rifampin or rifapentine (REMox‐TB and Rifaquin trials). (b) Estimated and observed results of the REMox‐TB and Rifaquin trials, as indicated by the number of relapse‐free (CFU‐free) patients (per protocol analysis). (c) Simulations of patient outcomes in TBTC study 31. (d) Simulations of patient outcomes in a hypothetical trial of a 4‐month high‐dose rifampin‐containing regimen. E, ethambutol; H, isoniazid; M, moxifloxacin; P, rifapentine; R, rifampin; Z, pyrazinamide. PK parameters observed in clinical trials and PD parameters obtained from the mouse studies were used for the simulations (Table 2). Solid lines are the mean predicted CFU counts (black) and plasma concentrations (rifampin, blue; moxifloxacin, green; rifapentine, red). Gray‐shaded areas are the areas between the lower and upper limits of the 95% confidence intervals of the predicted CFU counts. Dosing schedule: REMox‐TB trial, control arm: (months 0–2) rifampin 10 mg/kg, isoniazid 300 mg, pyrazinamide 25 mg/kg, and ethambutol 20 mg/kg, daily; (months 2–6) rifampin 10 mg/kg and isoniazid 300 mg daily. Ethambutol arm: (months 0–2) rifampin 10 mg/kg, moxifloxacin 400 mg, pyrazinamide 25mg/kg, and ethambutol 20 mg/kg daily; (months 2–4) rifampin 10 mg/kg and moxifloxacin 400 mg daily. Rifaquin trial, control arm: (months 0–2) rifampin 10 mg/kg, isoniazid 300 mg, pyrazinamide 25 mg/kg, and ethambutol 20 mg/kg daily; (months 2–6) rifampin 10 mg/kg and isoniazid 300 mg daily. Four‐month arm: (months 0–2) rifampin 10 mg/kg, moxifloxacin 400 mg, pyrazinamide 25 mg/kg, and ethambutol 20 mg/kg daily; (months 2–4) rifapentine 15 mg/kg and moxifloxacin 400 mg twice weekly. Six‐month arm: (months 0–2) rifampin 10 mg/kg, moxifloxacin 400 mg, pyrazinamide 25 mg/kg, and ethambutol 20 mg/kg daily; (months 2–6) rifapentine 20 mg/kg and moxifloxacin 400 mg weekly. TBTC study 31, control arm: (months 0–2) rifampin 10 mg/kg, isoniazid 300 mg, pyrazinamide 25 mg/kg, and ethambutol 20 mg/kg daily; (months 2–6) rifampin 10 mg/kg and isoniazid 300 mg daily. Four‐month arm: rifapentine arm: (months 0–2) rifapentine 1200 mg, isoniazid 300 mg, pyrazinamide 25 mg/kg and ethambutol 20 mg/kg daily; (months 2–4) rifapentine 1,200 mg and isoniazid 300 mg daily. Rifapentine and moxifloxacin arm: (months 0–2) rifapentine 1,200 mg, isoniazid 300 mg, moxifloxacin 400 mg, and pyrazinamide 25 mg/kg daily; (months 2–4) rifapentine 1,200 mg, isoniazid 300 mg, and moxifloxacin 400 mg daily.

References

    1. World Health Organization . Global tuberculosis report 2016. http://www.who.int/tb/publications/global_report/en/ (2016).
    1. Rosenthal, I.M. et al Dose‐ranging comparison of rifampin and rifapentine in two pathologically distinct murine models of tuberculosis. Antimicrob. Agents Chemother. 56, 4331–4340 (2012). - PMC - PubMed
    1. Dorman, S.E. et al Substitution of rifapentine for rifampin during intensive phase treatment of pulmonary tuberculosis: study 29 of the tuberculosis trials consortium. J. Infect. Dis. 206, 1030–1040 (2012). - PubMed
    1. Jayaram, R. et al Pharmacokinetics‐pharmacodynamics of rifampin in an aerosol infection model of tuberculosis. Antimicrob. Agents Chemother. 47, 2118–2124 (2003). - PMC - PubMed
    1. Weiner, M. et al Rifapentine pharmacokinetics and tolerability in children and adults treated once weekly with rifapentine and isoniazid for latent tuberculosis infection. J. Pediatric Infect. Dis. Soc. 3, 132–145 (2014). - PubMed

Substances