. 2017 Jun 15;546(7658):381-386.
doi: 10.1038/nature22405. Epub 2017 May 31.

Acetyl-CoA synthetase regulates histone acetylation and hippocampal memory

Affiliations

Acetyl-CoA synthetase regulates histone acetylation and hippocampal memory

Philipp Mews et al. Nature. .

Abstract

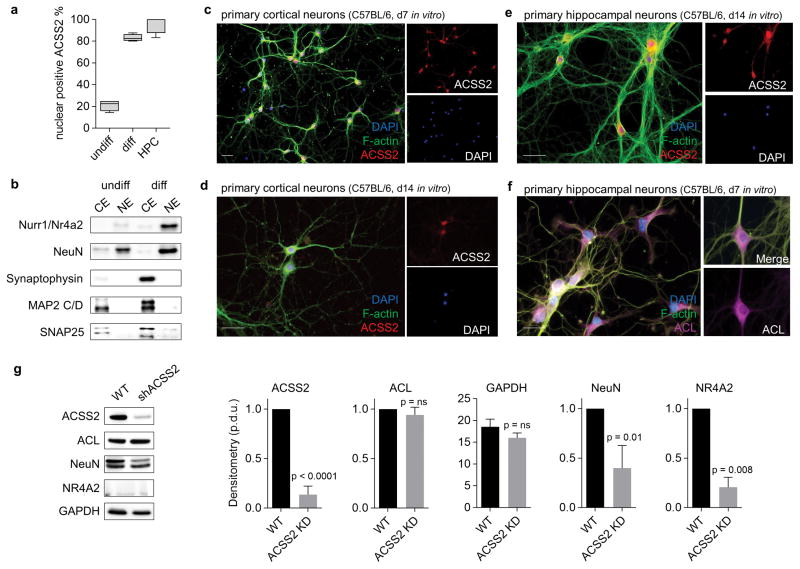
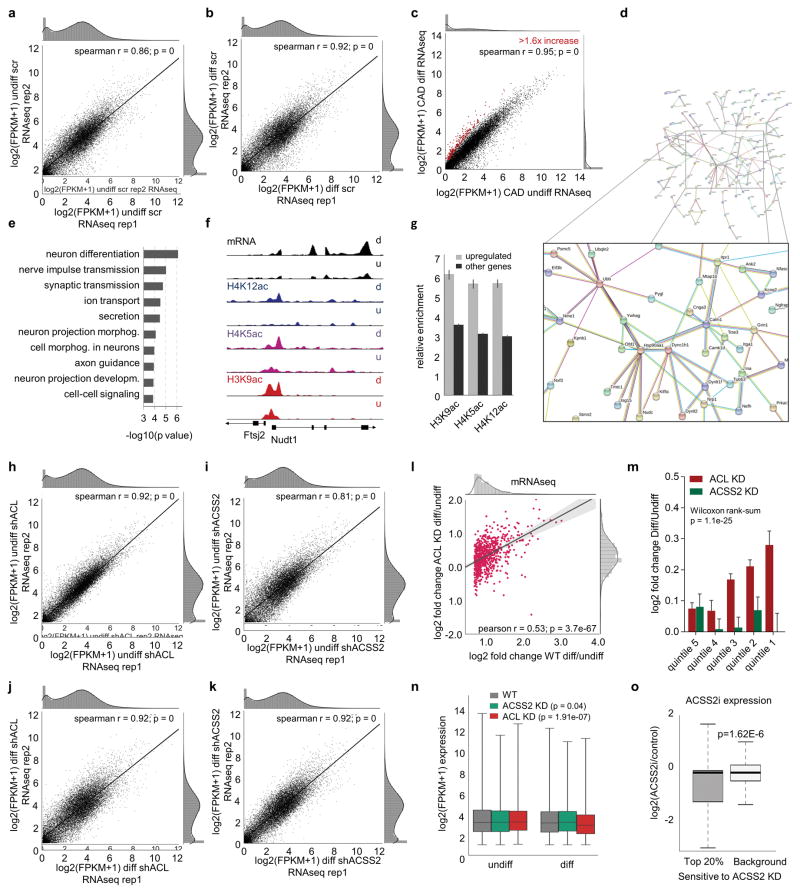
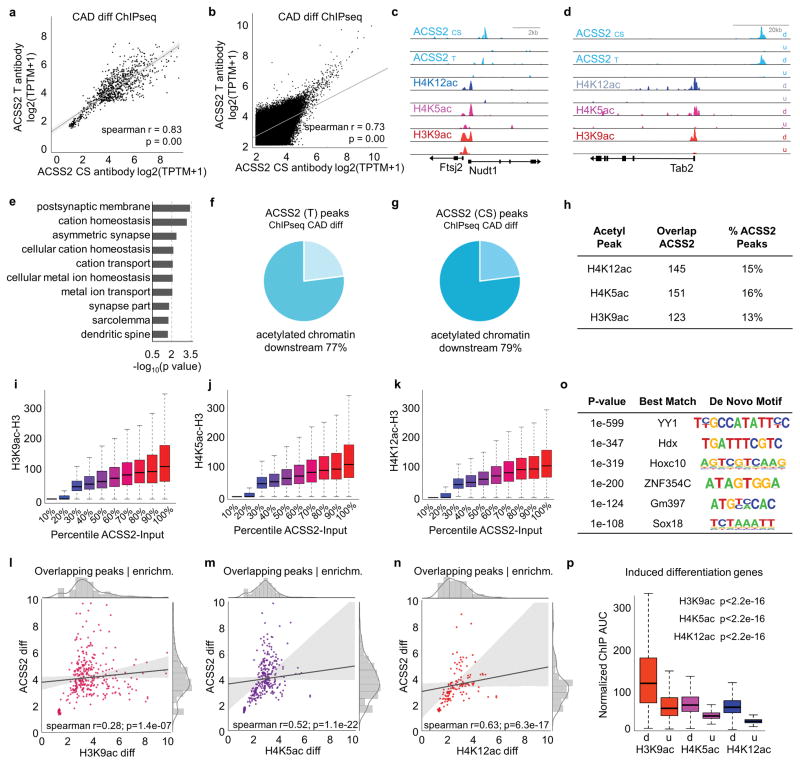
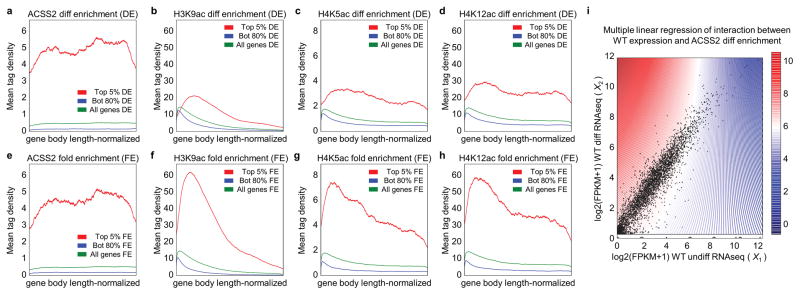
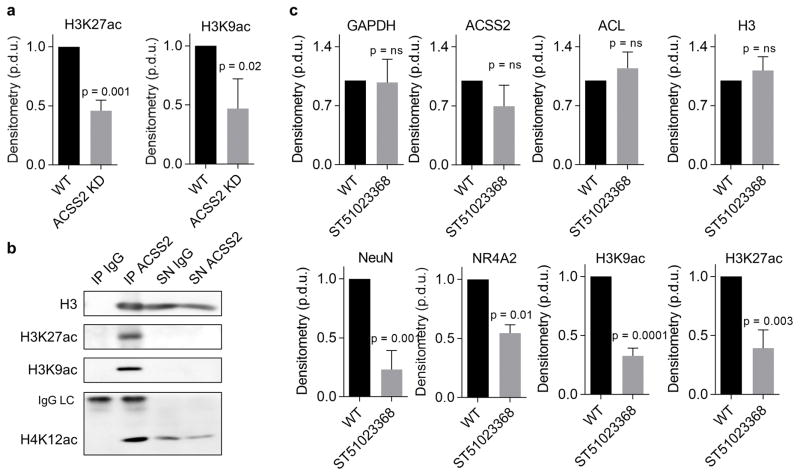
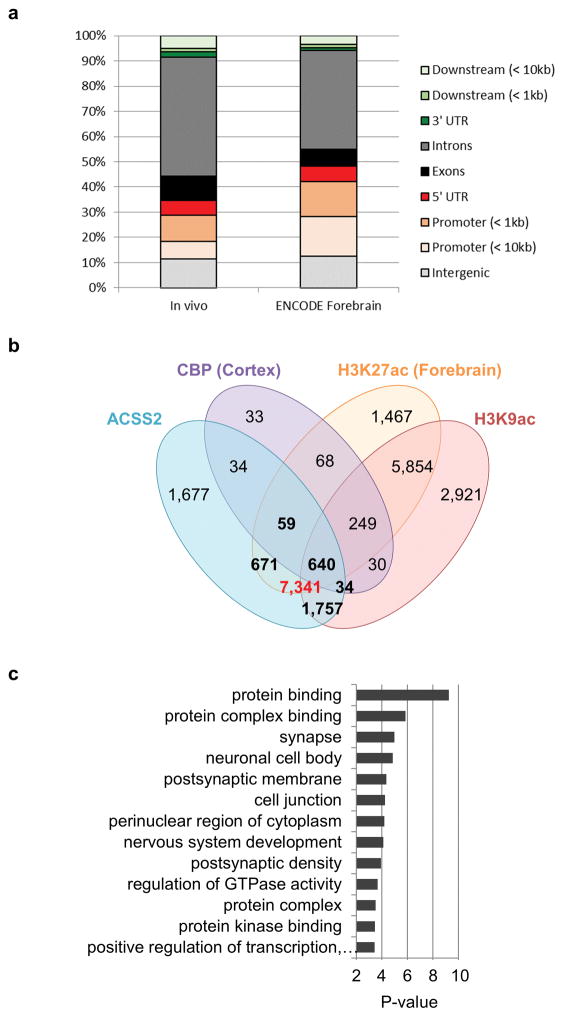
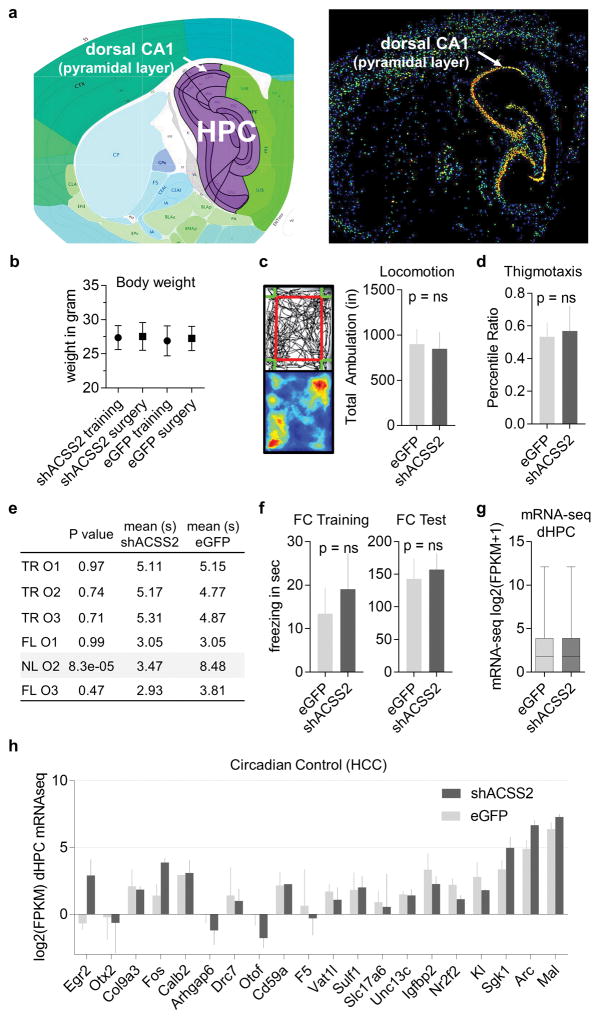
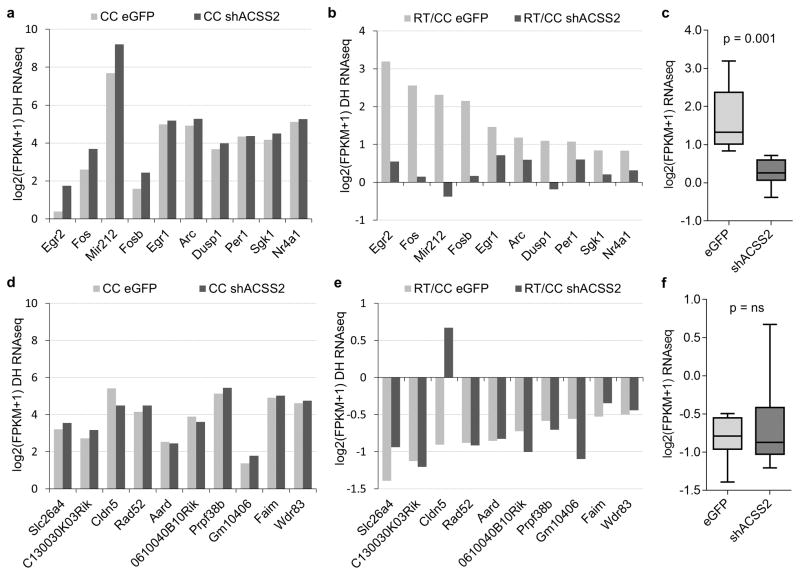
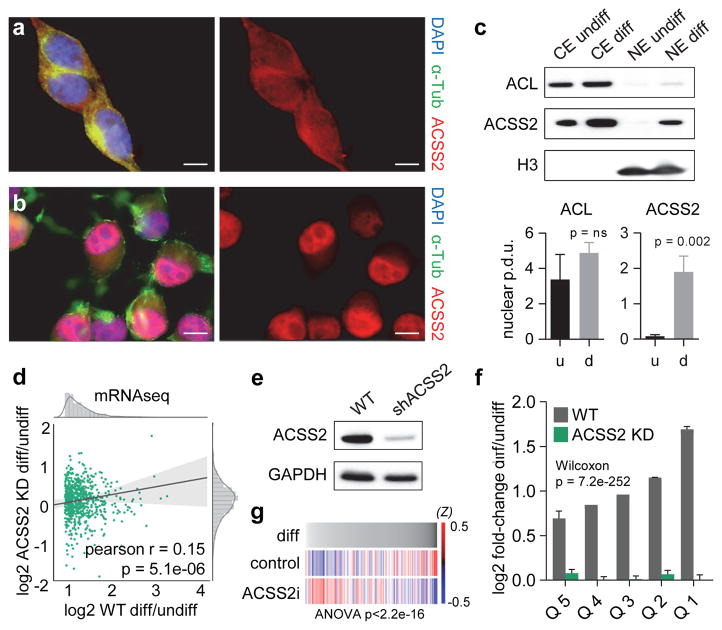
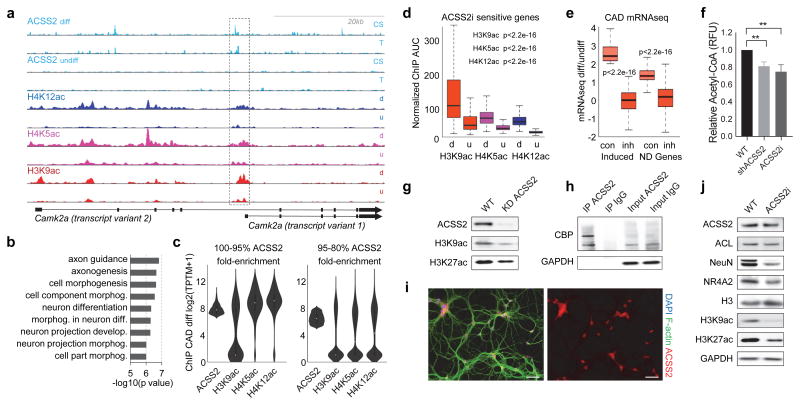
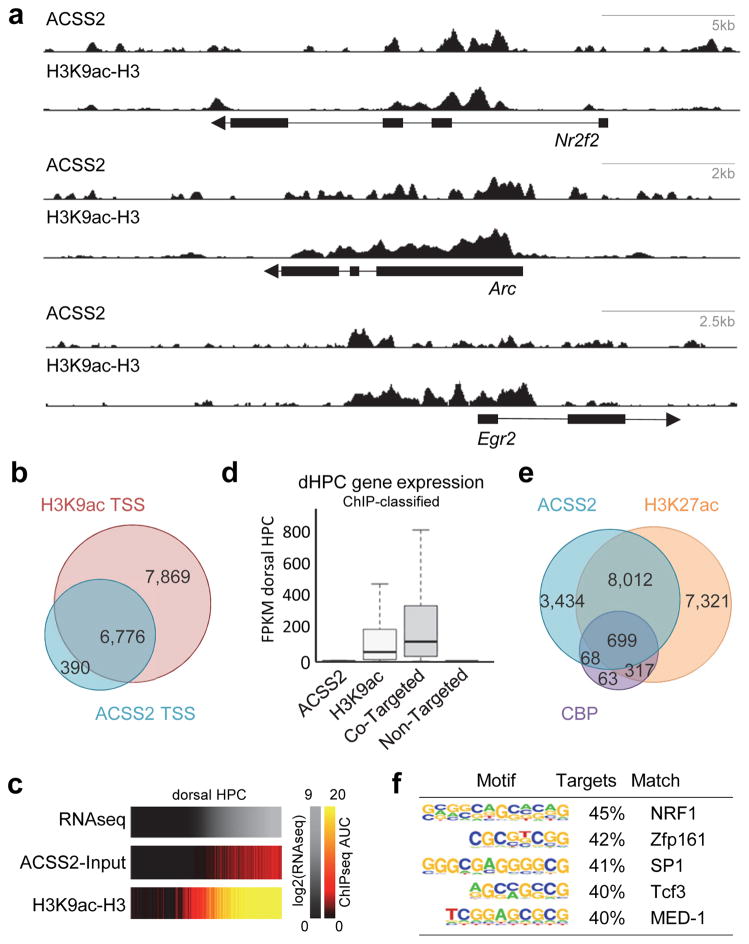
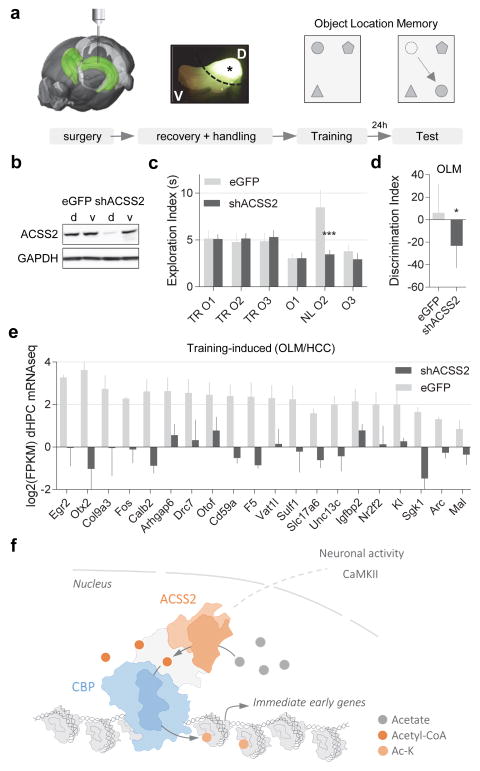
Metabolic production of acetyl coenzyme A (acetyl-CoA) is linked to histone acetylation and gene regulation, but the precise mechanisms of this process are largely unknown. Here we show that the metabolic enzyme acetyl-CoA synthetase 2 (ACSS2) directly regulates histone acetylation in neurons and spatial memory in mammals. In a neuronal cell culture model, ACSS2 increases in the nuclei of differentiating neurons and localizes to upregulated neuronal genes near sites of elevated histone acetylation. A decrease in ACSS2 lowers nuclear acetyl-CoA levels, histone acetylation, and responsive expression of the cohort of neuronal genes. In adult mice, attenuation of hippocampal ACSS2 expression impairs long-term spatial memory, a cognitive process that relies on histone acetylation. A decrease in ACSS2 in the hippocampus also leads to defective upregulation of memory-related neuronal genes that are pre-bound by ACSS2. These results reveal a connection between cellular metabolism, gene regulation, and neural plasticity and establish a link between acetyl-CoA generation 'on-site' at chromatin for histone acetylation and the transcription of key neuronal genes.


Conflict of interest statement

The authors declare no competing financial interests.

Figures

Extended Data Figure 1
ACSS2 localizes to the nucleus of neurons. (a) Shown is the percentage of cells with nuclear staining in ACSS2 immunofluorescence experiments (undiff – undifferentiated CAD cells, diff – differentiated CAD neurons, HPC – primary hippocampal neurons day 7; examined were a minimum of 50 cells in three replicate IF; T test undiff vs diff p < 0.0001, undiff vs HPC p < 0.0001, error bars: SE) (b) Western blots of cytoplasmic (CE) and nuclear (NE) extracts from undifferentiated CAD cells and differentiated CAD neurons were probed with the indicated antibodies. (c, d) Immunofluorescence in primary cortical neurons isolated from C57BL/6 embryos, at day 7 (c) and day 14 (d) of in vitro differentiation culture. ACSS2 locates predominantly to nuclei in differentiated primary cortical neurons. Scale bar = 25 μm (e) Immunofluorescence in primary hippocampal neurons isolated from C57BL/6 embryos at day 14 of in vitro differentiation culture. ACSS2 locates predominantly to nuclei in differentiated primary neurons. Scale bar = 25 μm (f) Immunofluorescence in primary hippocampal neurons at day 7 shows that ACL is chiefly localized to the cytoplasm of primary hippocampal neurons. Scale bar = 25 μm (g) Neuronal differentiation markers decrease in ACSS2 knockdown. CAD cells were infected with lentiviral control (WT) or knockdown vector (shACSS2). Western blots of lysates from stably infected differentiated cells were probed with the indicated antibodies, and quantified using ImageJ (n = 3, error bars: SE).
Extended Data Figure 2
(a–b) Correlation plots of replicate RNA-seq in (a) undifferentiated CAD cells and (b) differentiated CAD neurons for scramble control (spearman r = 0.86, p = 0; and spearman r = 0.92, p = 0). (c) Transcriptome analysis via RNA-seq, done in two highly correlated biological replicates, identified 894 genes that become upregulated in differentiated CAD neurons (red dots depict genes with >1.6-fold increase, spearman r = 0.95, p = 0). (d) Pathway analysis of the 894 upregulated genes (red dots in Fig. 2a) using StringDB. Shown is the protein-protein interaction graph depicting a network of binding partners that centers on key players of activity-dependent signaling and synaptic plasticity: Itpr1, Grin1, Nefh, Dync1h1, and Calm1. (e) Gene ontology (GO) enrichment analysis shows upregulation of neuronal pathways. GO was employed on the 894 genes that become upregulated in differentiated CAD neurons (Extended Data Fig. 2c; identified by RNA-seq, FE > 3.5, FDR < 0.005). (f) Genome browser view of Nudt from RNA-seq and ChIP-seq (H4K12ac, H4K5ac, and H3K9ac: mm10 chr5: 140,327,500–140,339,000). (g) Bar plot shows the relative genic enrichment of H3K9ac, H4K5ac, and H4K12ac at genes that are upregulated in the CAD neuron differentiation (>1.6-fold, grey bars) versus all other genes (black bars). (h–i) Correlation plots of replicate RNA-seq in undifferentiated CAD cells for ACL knockdown (h; spearman r = 0.92, p = 0), and ACSS2 knockdown (i; spearman r = 0.81, p = 0). (j–k) Correlation plots of replicate RNA-seq in differentiated CAD neurons for ACL knockdown (j; spearman r = 0.92, p = 0), and ACSS2 knockdown (k; spearman r = 0.92, p = 0). (l) ACL KD has much lower effect on differentiation-linked upregulation of neuronal gene expression program (compare to Fig. 1d). Scatter plot contrasts the fold-change FPKM of induced genes (Extended Data Fig. 2c) between WT and ACL KD (pearson r = 0.53, p = 3.7e-67). Marginal distributions show histogram and kernel density estimation. Ordinary least squares linear regression is displayed with 95% confidence interval. (m) Shown are the corresponding quintiles of upregulated genes (red dots in Extended Fig. 2c) with the greatest fold-change FPKM increase in WT. The ACL KD showed the same upward trend as WT (red bars, compared to WT black bars in Fig. 1f), contrasting the severe defect in ACSS2 KD (green bars; (for each quintile, columns represent the mean induction value of genes, p = 1.1*10–25, Wilcoxon rank-sum test, error bars: SE). (n) Boxplot of global mRNA transcript levels in undifferentiated (undiff) and differentiated (diff) CAD neurons from RNA-seq in WT (scramble control knockdown; grey), ACSS2 KD (shACSS2 #25 knockdown; green), and ACL KD (shACL #17 knockdown; red). Genome-wide transcript levels are reduced in diff ACL KD when compared to diff WT (p = 1.91e-07, Mann-Whitney U test, error bars: SE), whereas global reduction in diff ACSS2 KD is less significant when compared to diff WT (p = 0.04, Mann-Whitney U test, error bars: SD). (o) Genes sensitive to ACSS2 KD (top 20%) are also sensitive to the ACSS2i treatment, which lowers their expression compared to all genes (p = 1.62E-6, SD).
Extended Data Figure 3
ACSS2 is chromatin-bound in differentiated CAD neurons (a) ChIP-seq in differentiated CAD neurons was performed in replicate with two different antibodies to ACSS2. Correlation plot displays relative enrichment over corresponding MACS peaks (default parameters with Input as control, 1598 peaks). (b) Correlation plot displays relative ChIP-seq enrichment genome-wide. (c) UCSC Genome Browser views of ChIP-seq tracks show that, upon CAD neuron differentiation, increases in H4K5, H4K12, and H3K9 acetylation over the NUDT1 gene locus co-occur with ACSS2 enrichment (U–undiff, D–diff; chr5: 140,326,845–140,339,655). (d) UCSC Genome Browser view of indicated ChIP-seq tracks in undifferentiated CAD cells (u) and differentiated CAD neurons (d) over Tab2 locus (chr10: 7,875,000–8,004,000). (e) GO enrichment analysis of the genes most proximate to ACSS2 peaks demonstrates that neuron-specific genes are enriched. (f) Frequency of ACSS2 peaks (T antibody) located upstream of their target gene associated with histone acetylation. (g) Frequency of ACSS2 peaks (CS antibody) located upstream of their target gene associated with histone acetylation. (h) Table shows % direct overlap of ACSS2 peaks with H3K9ac, H4K5ac, and H4K12ac broad MACS peaks. (i–k) Decile plots depict enrichment of H3K9ac (i), H4K5ac (j), and H4K12ac (k) over ranked deciles of ACSS2 peak enrichment (zeroes removed). (l–m) Differentiation-induced co-enrichment of ACSS2 and acetyl broad peaks (MACS). Peak enrichment correlation indicated for H3K9ac (i; spearman r = 0.28, p = 1.4e-07), H4K5ac (m; spearman r = 0.52, p = 1.1e-22), and H4K12ac (n; spearman r = 0.63, p = 6.3e–17). (o) Discovered de novo motifs for transcription factor binding sites predicted by HOMER from all ACSS2 ChIP-seq peaks called by MACS in differentiated CAD neurons. (p) ChIP-seq enrichment of differentiation-induced genes as a group show correlation with histone acetylation in differentiated CAD neurons.
Extended Data Figure 4
(a) UCSC Genome Browser views of ChIP-seq tracks demonstrate that increases in H4K5, H4K12, and H3K9 acetylation co-occur with ACSS2 enrichment over the Idua (Alpha-L-iduronidase) gene locus upon CAD neuron differentiation (U–undiff, D–diff; chr5: 108,649,457–108,687,261). (b) At the Slc19A1 (Solute Carrier Family 19 – Folate Transporter – Member 1) gene, elevated histone H4K5, H4K12, and H3K9 acetylation levels correspond with increasing ACSS2 enrichment in CAD neuron differentiation (chr10: 76,761,141–77,170,455).
Extended Data Figure 5
(a–d) Meta-gene enrichment analysis shows ChIP occupancy for ACSS2 (a), H3K9ac (b), H4K5ac (c), and for H4K12ac (d) across the top 5% of genes enriched for ACSS2 in differentiated CAD neurons (Top 5% DE; red). The bottom 80% of genes (Bot 80% DE) is shown in blue, and the average signal across all genes (All genes DE) is shown in green. (e–h) Meta-gene enrichment analysis shows ChIP occupancy for ACSS2 (e), H3K9ac (f), H4K5ac (g), and for H4K12ac (h) at the top 5% of genes that become dynamically bound by ACSS2 upon neuronal differentiation (Top 5% DE; red). The bottom 80% of genes (Bot 80% DE) is shown in blue, and the average signal across all genes (All genes DE) is shown in green. (i) Multiple linear regression analysis was implemented to model the interaction between genic ACSS2 enrichment and WT gene expression changes, and to visualize the interaction between differentiation-linked gene expression changes and ACSS2 recruitment to chromatin. The contour plot of this fitted regression model displays high levels of ACSS2 enrichment in red and low levels in blue, and is overlaid with the scatter plot of the independent gene expression variables. The visualized model demonstrates that high ACSS2 enrichment (red) corresponds to increased gene expression in the CAD neuronal differentiation.
Extended Data Figure 6
(a) Western blot analysis of whole cell lysates shows that lentiviral shRNA-mediated KD of ACSS2 lowers H3K9 and H3K27 acetylation (compare to Fig. 2g), quantified using ImageJ (n = 3, error bars: SE). (b) Western blot analysis of eluates and supernatants of IgG control and ACSS2 co-IP experiments indicates that ACSS2 binds to acetylated chromatin. (c) Western blots of lysates from primary hippocampal neurons (d7) treated for 24h with the ACSS2i, probed with the indicated antibodies (compare to Fig. 2j), and quantified using ImageJ (n = 3, error bars: SE).
Extended Data Figure 7
(a) Genome-wide compartment analysis of the in vivo hippocampal ChIP-seq of H3K9ac, and the mouse forebrain H3K9ac ChIP-seq from ENCODE, showing a similar peak distribution genome-wide: originating in different brain regions, the in vivo H3K9ac ChIP data are in strong agreement (Spearman R = 0.67) (b) Shown is a 4-way Venn diagram depicting overlap of RefSeq transcripts targeted by the indicated enzyme or modification (peaks for CBP (GSM1629373) and H3K27ac (GSM1629397) in mouse cortical neurons were called using MACS2 (narrow peaks, FDR 0.1%) with an input sonication efficiency control (GSM1629381); peaks were associated to the nearest TSS among all RefSeq transcripts) (c) Gene Ontology enrichment analysis has been performed on common CBP:ACSS2 targets, indicating that these enzymes co-target genes that modulate synapse biology and synaptic membrane potential.
Extended Data Figure 8
(a) ACSS2 RNA in situ hybridization on CA1 sagittal section ACSS2 (left: reference atlas, HPC – hippocampus proper; right: ACSS2 RNA in situ hybridization on HPC sagittal section, adapted from Allen Mouse Brain Atlas). (b) Plot shows weight of eGFP-AAV9 control and shACSS2-AAV9 knockdown mice before intracranial surgery, and following recovery before OLM task training (p = ns, n = 10 per group, error bars: SD). (c, d) ACSS2 knockdown animals showed no defect in locomotion or thigmotaxis (tendency to remain close to vertical surfaces in an open field, a measure of anxiety), as quantified over five minutes in the open field test; exemplary heatmap of tracking data shown in (c) (p = ns, n = 10 per group, error bars: SD). (e) Table of the exploration times by eGFP-AAV9 control and shACSS2-AAV9 knockdown mice recorded for the three objects (O1–3) during the first OLM training session (TR – Training) and the 24h retention test (NL – object in novel location, FM – objects remained in former location). (f) Compared to the control eGFP-AVV9 mice, ACSS2 knockdown mice show no defect in contextual fear memory. Freezing in FC chamber on day of contextual fear conditioning was recorded and quantified pre-shock (FC Training; p = ns, n = 10 per cohort, error bars: SD). Fear memory was measured as the freezing response after re-exposure to the context 1 day after contextual fear conditioning (aversive stimulus: 1.5 mA electrical shock; p = ns, n = 10 per cohort, error bars: SD). (g) RNA-seq was performed on the dorsal hippocampus of eGFP control and shACSS2 knockdown animals. Global transcript levels are not affected by ACSS2 knockdown (dHPC – dorsal hippocampus; four animals per group, two replicates for each condition, p = ns, Paired T test, error bars: SD) (h) Baseline expression of immediate-early genes in untrained animals is unaltered in ACSS2 KD mice. RNA-seq was performed on the dorsal HPC of eGFP control and shACSS2 KD animals (r = 0.82, p < 0.0001; HCC – homecage circadian control).
Extended Data Figure 9
ACSS2 regulates retrieval-induced upregulation immediate-early genes in vivo. (a) Genome-wide RNA-seq was performed on the dorsal hippocampus of eGFP control and shACSS2 knockdown animals. The analysis was focused on the set of previously identified and validated genes that become upregulated during the sensitive period following memory retrieval. The baseline expression of immediate-early genes in untrained animals is not changed in shACSS2-AAV9 mice when compared to eGFP-AAV9 control mice (CC – circadian control). (b) During the sensitive period following contextual memory retrieval (RT – 30 min post-exposure to conditioning chamber 24h following fear conditioning), immediate-early genes are upregulated in dorsal HPC in the control injected animals. In contrast, the dynamic retrieval-induced expression of these early response genes is absent in ACSS2 knockdown animals (p = 0.001, Paired T test). (c) Boxplot shows the induction defect of immediate-early genes in shACSS2-AAV9 injected animals (RT/CC). (d) The baseline expression of genes that are downregulated following contextual memory retrieval is not altered in ACSS2 knockdown animals. (e) Downregulation of retrieval-responsive genes occurs both in eGFP control and ACSS2 knockdown mice, except Cldn5. (f) Boxplot compares retrieval-induced downregulation of retrieval-responsive genes in the dorsal hippocampus in eGFP control versus shACSS2 knockdown (RT/CC).
Figure 1
Figure 1
Nuclear ACSS2 supports neuronal gene expression. (a) ACSS2 localizes to the cytoplasm in undifferentiated CAD neurons. ACSS2 was imaged by immunofluorescence microscopy in CAD cells (DAPI and α-Tubulin immunostaining visualize nuclei and cytoplasm, respectively). Scale bar = 10 μm (b) ACSS2 localizes to the nucleus of differentiated CAD neurons. (c) Western blot analysis of cytoplasmic (CE) and nuclear (NE) extracts from undifferentiated CAD cells (u) and differentiated CAD neurons (d) for ACSS2, ACL, and histone H3. Nuclear ACSS2 expression is increased upon differentiation (t test p = 0.002, n = 3, SD). (d) ACSS2 KD reduces differentiation-linked upregulation of neuronal gene expression program. Scatter plot contrasts the fold-change FPKM of induced genes (Extended Data Fig. 2c) between WT and ACSS2 KD (pearson r = 0.15, p = 5.1e-06). Marginal distributions show histogram and kernel density estimation. Ordinary least squares linear regression is displayed with 95% confidence interval. (e) Western blot of lysates from differentiated CAD neurons that were infected with lentiviral control (WT) or ACSS2 knockdown vector (shACSS2) (quantification shown in Extended Data Fig. 1g; n = 3). (f) ACSS2 KD greatly lowers gene upregulation. Quintiles of upregulated genes (red dots in Extended Data Fig. 2c) with the greatest fold-change increase in WT (grey). Corresponding gene quintiles depict fold-change FPKM in ACSS2 KD (green) (for each quintile, columns represent the mean induction value of genes, p = 7.2e-252, Wilcoxon rank-sum test, SE). (g) ACSS2i treatment in CAD neurons results in reduced expression of differentiation-induced genes. Plotted are all genes in order of fold-change in WT CAD differentiation, and z-scores were computed for ACSS2i-treatment and control, representing upregulation as blue and downregulation as red (RNA-seq in 24h ACSS2i-treated and DMSO-control neurons, genes removed with z-score < 0.5).
Figure 2
Figure 2
ACSS2 is recruited to transcriptionally active chromatin and promotes neuronal histone acetylation. (a) Genome browser tracks showing ChIP-seq over the Camk2a locus shows that increases in H4K5, H4K12, and H3K9 acetylation co-occur with proximate ACSS2 enrichment upon CAD neuron differentiation (chr18: 60,920,000–60,990,000). (b) GO term enrichment analysis of top 5% genes that become ACSS2-bound in CAD neuron differentiation show neuronal pathways. (c) Violin-contour plots show ChIP-seq enrichment of the indicated histone acetylation occurs with top-ranked ACSS2 enrichment during CAD neuronal differentiation. (d) ChIP-seq enrichment of the 299 genes that are reduced upon ACSS2i treatment (details in methods) shows high correlation with histone acetylation in the differentiated state (d – differentiated, u – undifferentiated). (e) Analysis of all genes previously linked to neuronal differentiation (ND genes, AmiGO annotation set of 1,315 genes), and the subset of known ND genes that are induced in CAD cell differentiation (Induced), show reduced expression in ACSS2i-treated CAD neurons (inh) compared to DMSO control (con). (f) Nuclear acetyl-CoA levels are reduced in response to either KD of ACSS2 (mean Δ = −0.19 ± 0.03, p = 0.003) or application of the ACSS2 inhibitor (mean Δ = −0.25 ± 0.05, p = 0.006; n = 3, SD). (g) Western blot analysis of whole cell lysates shows that lentiviral shRNA-mediated KD of ACSS2 lowers H3K9 and H3K27 acetylation (quantifed in Extended Data Fig. 6a). (h) Western blot analysis of IP eluates shows that CBP is co-IPed in the ACSS2 IP, but not in the control IgG IP. (i) Immunofluorescence in primary hippocampal neurons shows nuclear localization of ACSS2 (day 7 of in vitro differentiation culture, isolated from C57BL/6 embryos). Scale bar = 50 μm (j) Western blots of lysates from primary hippocampal neurons (d7) treated for 24h with the ACSS2i, probed with the indicated antibodies (quantified in Extended Data Fig. 6c) shows reduction of histone acetylation.
Figure 3
Figure 3
ACSS2 ChIP-seq localization is linked to histone acetylation in vivo in mouse hippocampus (HPC). (a) ChIP-seq for ACSS2 and H3K9ac in mouse HPC. Track-views show ACSS2 and H3K9ac for three canonical neuronal genes involved in memory: Arc, Egr2, and Nr2f2 (chr15:74496025–74506488, chr10:66991018–67006804, and chr7:77488549–77516626, respectively). (b) Venn diagram shows in vivo HPC ACSS2 and H3K9ac peaks co-localize with the nearest gene TSS (< 1kb from peak) among all RefSeq transcripts. (c) RNA-seq expression in dorsal HPC correlates with ACSS2 binding and enrichment of H3K9 acetylation. (d) Expression profile of genes classified by way of their ACSS2 and H3K9ac enrichment state (d) Venn diagram shows the overlap between ACSS2 targeted genes (HPC), and CBP and H3K27ac enrichment for entire set of peaks (ENCODE CBP and H3K27ac ChIP-seq in mouse forebrain and cortex). (e) RNA expression heat map in HPC showing co-enrichment of ACSS2 and H3K9ac. (f) Motif analysis at ACSS2 peaks from in vivo ChIP-seq in HPC showing top enrichment of NRF1, a neuronal transcription factor.
Figure 4
Figure 4
ACSS2 knockdown in dorsal HPC impairs object location memory (OLM) and upregulation of immediate-early genes following training. (a) Stereotactic surgery was performed to deliver AAV9 knockdown vector into the dorsal HPC (AP, −2.0mm; DV, −1.4mm; ML, +/−1.5mm from Bregma); four weeks later habituated mice received training for object location memory (four 5 min training sessions in arena with three different objects). 24 hours later the mice were given a retention test in which one object was moved to a novel location (n = 10 per cohort). (b) Western blot analysis of HPC tissue harvested from animals injected dorsally with either eGFP control or ACSS2 KD vector (d – dorsal, v – ventral) shows specific reduction of ACSS2 in dorsal HPC. (c) ACSS2 KD animals are impaired in object location memory. eGFP-control and shACSS2-AAV9 mice display no preference for any of three objects (O1–3) during the OLM training session (TR – Training). In the 24h retention test, eGFP-AAV9 control mice show preference for novel object location (NL), whereas the shACSS2 KD mice display no preference for the novel object location (NL). (d) The spatial memory defect in ACSS2 KD animals manifests in lowered discrimination index (% DI = (t NL − t FL)/(t NL+ t FL)) compared to control mice (ΔDI = −29.5 ± 11.4, p = 0.02; n = 10, SD). (e) Training-induced expression of a cohort of immediate-early genes (see Extended Data Fig. 8h) is greatly attenuated in ACSS2 KD animals (four animals per group, two replicates for each condition, p < 0.0001, Paired T test, SD). (f) Model for ACSS2 functioning as a chromatin-bound coactivator to locally provide acetyl-CoA to promote histone acetylation and activity-induced upregulation of immediate-early genes.

Comment in

References

    1. Kandel ER, Dudai Y, Mayford MR. The molecular and systems biology of memory. Cell. 2014;157:163–186. - PubMed
    1. Zovkic IB, Guzman-Karlsson MC, Sweatt JD. Epigenetic regulation of memory formation and maintenance. Learn Mem. 2013;20:61–74. - PMC - PubMed
    1. Gräff J, Tsai LH. Histone acetylation: molecular mnemonics on the chromatin. Nat Rev Neurosci. 2013;14:97–111. - PubMed
    1. Wood Ma, et al. Transgenic mice expressing a truncated form of CREB-binding protein (CBP) exhibit deficits in hippocampal synaptic plasticity and memory storage. Learn Mem. 2005;12:111–119. - PMC - PubMed
    1. Korzus E, Rosenfeld MG, Mayford M. CBP histone acetyltransferase activity is a critical component of memory consolidation. Neuron. 2004;42:961–972. - PMC - PubMed

Publication types

MeSH terms