. 2017 Jun 8;546(7657):297-301.
doi: 10.1038/nature22381. Epub 2017 May 31.

Dynamic corticostriatal activity biases social bonding in monogamous female prairie voles

Affiliations

Dynamic corticostriatal activity biases social bonding in monogamous female prairie voles

Elizabeth A Amadei et al. Nature. .

Abstract

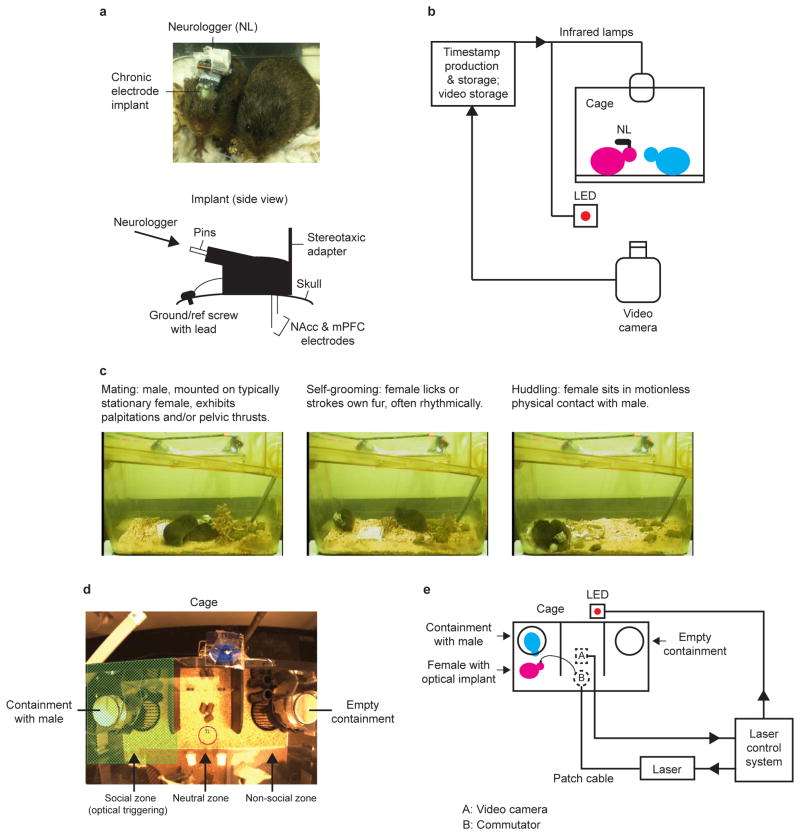
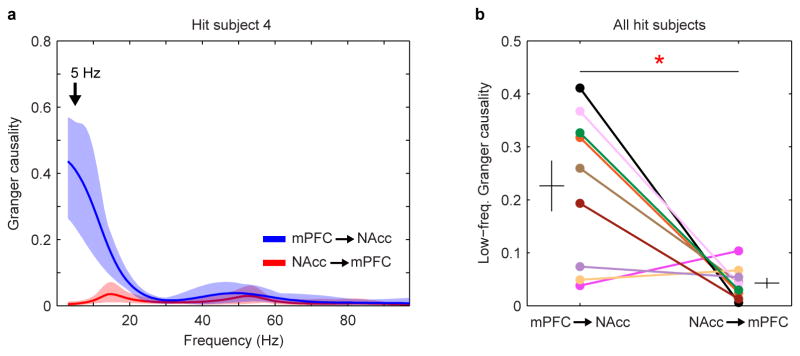
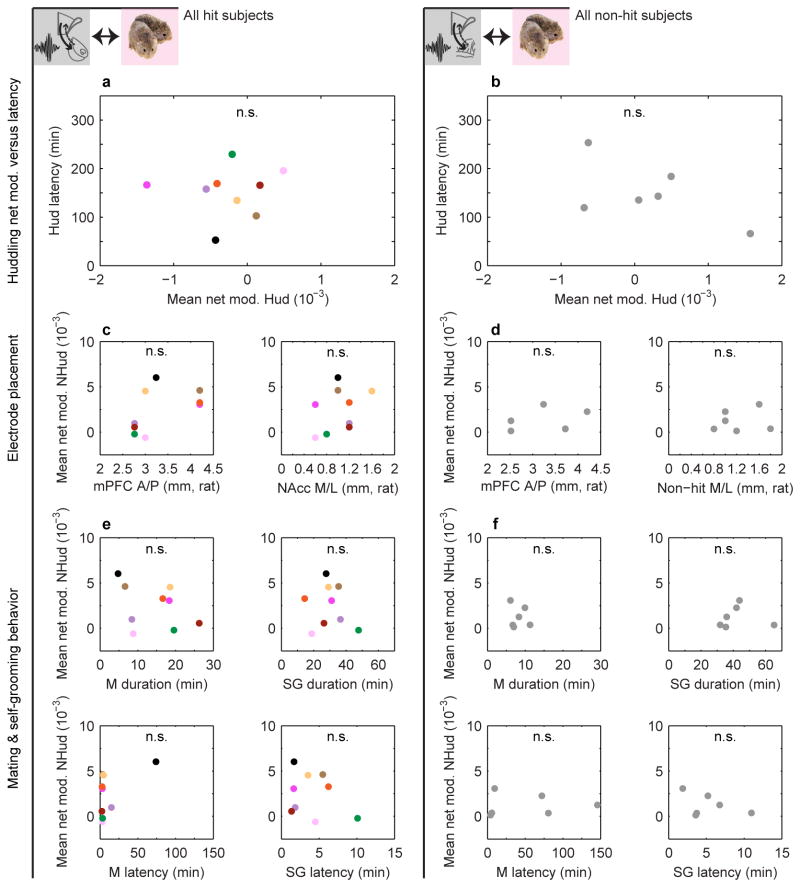
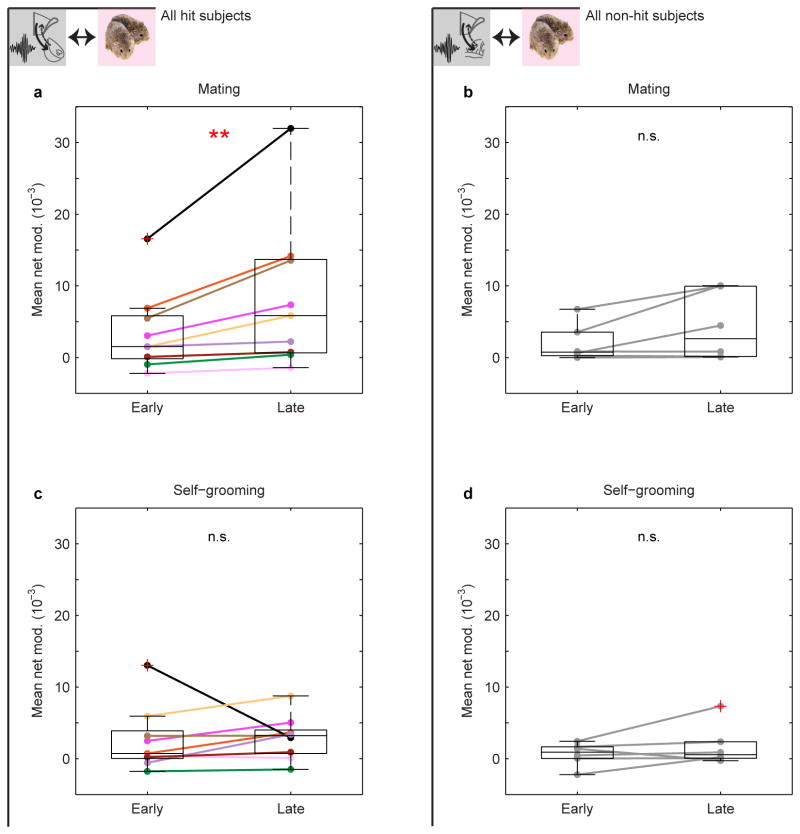
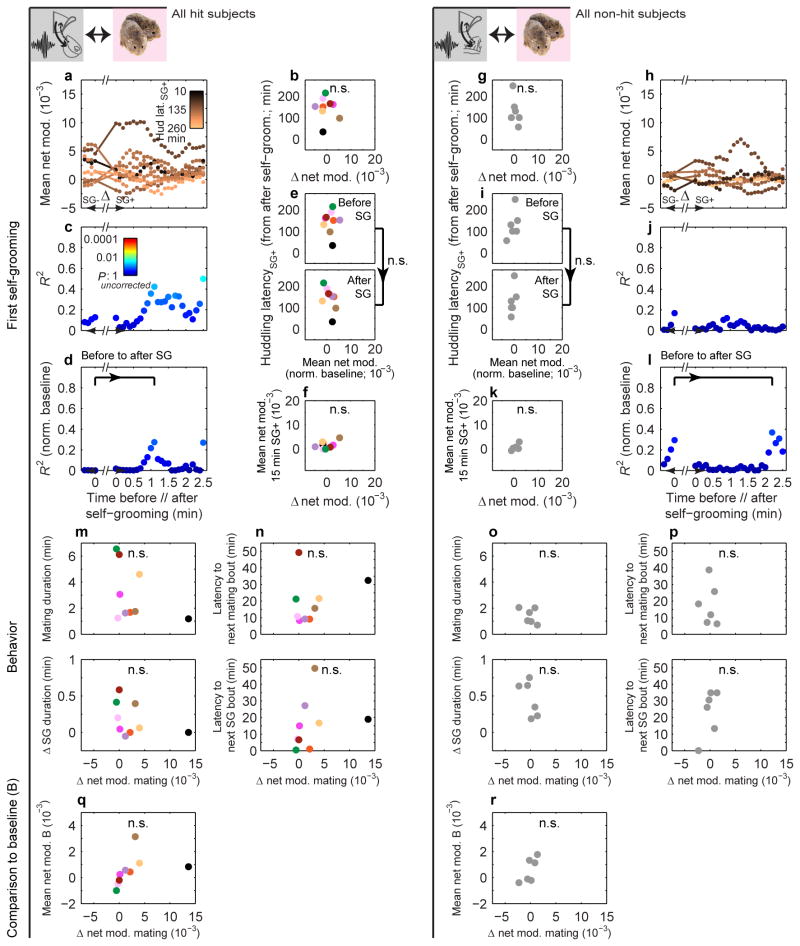
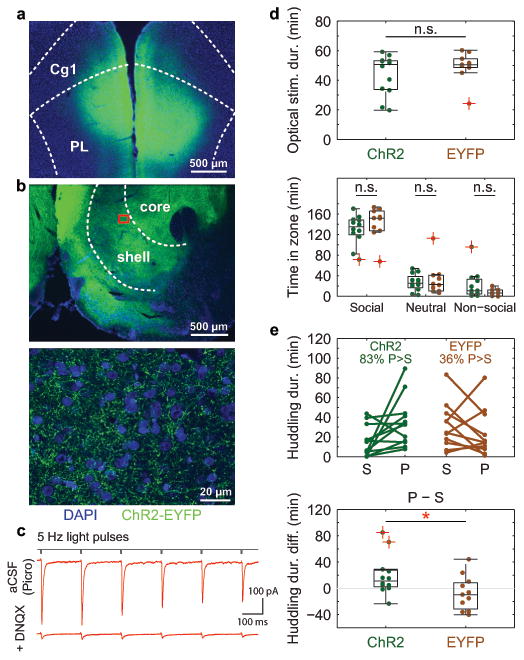
Adult pair bonding involves dramatic changes in the perception and valuation of another individual. One key change is that partners come to reliably activate the brain's reward system, although the precise neural mechanisms by which partners become rewarding during sociosexual interactions leading to a bond remain unclear. Here we show, using a prairie vole (Microtus ochrogaster) model of social bonding, how a functional circuit from the medial prefrontal cortex to nucleus accumbens is dynamically modulated to enhance females' affiliative behaviour towards a partner. Individual variation in the strength of this functional connectivity, particularly after the first mating encounter, predicts how quickly animals begin affiliative huddling with their partner. Rhythmically activating this circuit in a social context without mating biases later preference towards a partner, indicating that this circuit's activity is not just correlated with how quickly animals become affiliative but causally accelerates it. These results provide the first dynamic view of corticostriatal activity during bond formation, revealing how social interactions can recruit brain reward systems to drive changes in affiliative behaviour.


Figures

Extended Data Figure 1
Extended Data Figure 1. Preparations for electrophysiological and optogenetic experiments
a, Neurologger recording device secured to a female during cohabitation with a male. Neurologger interfaces with a chronic electrode implant targeting mPFC and NAcc. b, Schematic of experimental setup. Simultaneous video and neural recording is synchronized by periodic timestamps. c, Summarized ethogram definitions of mating, self-grooming and huddling used to score experimental videos. d, Arena used for cohabitation in optogenetics experiments. Arena is divided into social, neutral, and non-social zones. Food is placed in the center of the neutral zone. Male is contained under a cup in the social zone, and female, implanted with optical fibers, is allowed to freely explore the arena. Optical stimulation is triggered whenever she is in the social zone (green hatched area; red circle is visualization of tracking) for up to 1 hour within the cohabitation period. Social zone is defined as consistently as possible across experiments based on physical features of arena. e, Schematic of cohabitation setup, additionally showing how laser is controlled by video recording to automatically deliver optical stimulation when female is in the social zone.
Extended Data Figure 2
Extended Data Figure 2. Placement of local field potential electrodes in all subjects
a, Electrodes in hit subjects (n = 9) targeting mPFC and NAcc, b, verified with electrolytic lesions (scale bar, 500 μm). Anterior/posterior locations of brain sections (units of rat brain atlas; see Methods) are indicated. c, Electrodes in non-hit subjects (n = 6) targeting mPFC and posterior to NAcc (within/bordering BNST). SHy: septohypothalamic nucleus. The rat brain in this and other figures has been reproduced with permission from [14].
Extended Data Figure 3
Extended Data Figure 3. Behavioral characterization of hit and non-hit subjects
a, Number of bouts, total duration, and latency for mating, self-grooming and huddling in hit (n = 9) and non-hit (n = 6) subjects. No significant differences exist between subject groups (all P > 0.05). b, Measures of mating and self-grooming duration and latency do not correlate with huddling latency (n = 15; all P > 0.05). “Percent M [or SG] before Hud latency” refers to percentage of time each animal spent mating or self-grooming prior to reaching its huddling latency. c, Latency is modulated across behaviors (n = 15; χ(2) = 18.53, P < 0.001, Friedman Test), with mating and self-grooming showing shorter latencies compared to huddling but similar latencies to each other (SG vs. Hud, P < 0.001; M vs. Hud, P = 0.001; M vs. SG, P = 0.454, Wilcoxon signed-rank). Reported P-values in a-c are Bonferroni-corrected for multiple comparisons (see Methods). Boxplots show median and interquartile range.
Extended Data Figure 4
Extended Data Figure 4. Net modulation data for all subjects
Net modulation values (2-s, non-overlapping windows) sampled over a baseline solo period (gold points) and 6-hr cohabitation for all hit (#1-9) and non-hit (#10-15) subjects. Values that temporally overlap with mating, self-grooming and huddling behaviors (top hashes) are color-coded accordingly. All non-scored values are indicated as “other-cohab,” which together with mating and self-grooming represent “nonhuddling” values. Cumulative distributions of net modulation values coded by behavior are shown in right panel for each subject.
Extended Data Figure 5
Extended Data Figure 5. Granger causality in mPFC-NAcc circuit during mating
a, Granger causality spectra in the mPFC-to-NAcc and NAcc-to-mPFC directions for example subject. Solid lines and shaded regions show mean and mid-95 percentile range, respectively, of the n = 40 Granger causality estimates for a given brain-area direction (see Methods). b, Comparison of Granger causality at 5 Hz in the two directions across hit subjects (n = 9). Granger causality is significantly higher in the mPFC-to-NAcc direction (t8 = 3.29, P = 0.011). Error bars show mean ± s.e.m.
Extended Data Figure 6
Extended Data Figure 6. Specificity of correlation between nonhuddling net modulation and huddling latency
a, Mean huddling net modulation is uncorrelated with huddling latency in hits and (b) non-hits (all P > 0.05). c, Mean nonhuddling net modulation is uncorrelated with electrode placement (mPFC anterior (A)-posterior (P) location or NAcc/non-hit medial (M)-lateral (L) location; units of rat brain atlas) in both hits (n = 9) and (d) non-hits (n = 6) (all P > 0.05). e, Mean nonhuddling net modulation is uncorrelated with mating and self-grooming latency and total duration in hits and (f) non-hits (all P > 0.05).
Extended Data Figure 7
Extended Data Figure 7. Net modulation during early and late mating and self-grooming
a, Mean net modulation during mating increases over time in hits (n = 9, P = 0.008) but not (b) non-hits (n = 6, P = 0.438). c, Mean net modulation during self-grooming shows no significant change in either hits (P = 0.406) or (d) non-hits (P = 0.438). P-values in a-d are Bonferroni-corrected for multiple comparisons (see Methods). Mean early and late values for mating are derived from the first and last mating bouts. Mean values for self-grooming are derived from early and late self-grooming samples matched in number to the first and last mating bouts (see Methods). Boxplots show median and interquartile range.
Extended Data Figure 8
Extended Data Figure 8. Behavioral specificity of correlation between local change in net modulation around mating and huddling latency
a, Mean nonhuddling (NHud) net modulation values within 1 min moving windows (stepped by 0.1 min) before (SG-) and after (SG+) the first self-grooming bout of hits (n = 9) and (h) non-hits (n = 6). Each subject's values are color-coded by that subject's latency to huddle from the end of the self-grooming bout (latencySG+). b, Change in mean net modulation from immediately before to after the first self-grooming bout (indicated by line segments in a) is uncorrelated with huddling latencySG+ in hits (R = 0.01, P = 0.787) and (g) non-hits (R = 0.27, P = 0.290; line segments in h). c, Strength of correlation between mean net modulation and huddling latencySG+ shows no consistent increase in either hits or (j) non-hits. d, e, Subtracting out the mean baseline net modulation from the local values around self-grooming confirms no significant increase in correlation strength in either hits (P = 0.164; permutation test on difference in R (0.27) between bracketed time points) or (i, l) non-hits (P = 0.655, observed R difference of 0.07). f, Change in mean net modulation from immediately before to after first self-grooming bout is uncorrelated with mean NHud net modulation in the 15 min after self-grooming in hits (R = 0.24, P = 0.180) and (k) non-hits (R = 0.55, P = 0.090). m, Change in net modulation around first mating bout (Fig. 3e, j x-axis) is uncorrelated with local behavioral parameters (change in self-grooming duration around bout and mating duration within bout) in hits and (o) non-hits (all P > 0.05). It is further uncorrelated with the latency to next mating or self-grooming bouts (n, p) and the mean net modulation during the baseline solo period (q, r) in hits and non-hits (all P > 0.05).
Extended Data Figure 9
Extended Data Figure 9. Validation of virus injection and optical implant locations
a, Representative coronal sections showing estimated centers of bilateral virus injection and (b) optical implant placement for in vivo optogenetics subjects. Virus injection localization was based on minor tissue damage at dorsal-most surface of the coronal section where injection syringe initially entered the brain, the densest concentration of fluorescence and physical tracts of damage left by injection syringe. Optical implant localization was based on physical tracts of damage left by optical implant. Morphology of corpus callosum was used to determine anterior/posterior position of injections and implants. c, Virus injection and (d) optical implant locations for all in vivo optogenetics subjects. ChR2-expressing subjects (n = 12) are indicated by circles with dotted centers. Control subjects (n = 11) are indicated by circles with empty centers. Each color is a separate subject, with two circles per subject (bilateral injection and optical implant). All injection center locations fall within the prelimbic cortex and all optical implant locations fall within the medial NAcc. In a-d, the anterior/posterior location of each section (units of rat brain atlas) is indicated on left-hand side of section. IL: infralimbic cortex; MO: medial orbital cortex.
Extended Data Figure 10
Extended Data Figure 10. Validation of light-induced electrophysiological responses in mPFC and NAcc
a, Representative image of whole-cell patch clamp recording from a prelimbic mPFC neuron cell body in slice preparation. Recording electrode (tip denoted with white arrowhead) is patched onto a cell, and an optical fiber is oriented towards the cell for optogenetic stimulation. b, Example light-evoked potential (average response to 5, 1 ms light pulses; see Methods) in a prelimbic mPFC neuron in the presence of tetrodotoxin (TTX; 1 μM) to show a direct effect of light stimulation. c, Whole-cell patch clamp recordings were obtained from n= 7 putative medium spiny neurons (from 4 subjects) in NAcc. Anterior/posterior location of each section (units of rat brain atlas) indicated on bottom-right of section. d, Average electrophysiological responses (excitatory post-synaptic potentials (EPSPs; cells 1-4) or currents (EPSCs; cells 5-7)) to 5, 1 ms light pulses delivered onto the cell. Application of Picro (second column) had no consistent effect on electrophysiological responses, whereas DNQX (third column) disrupted them, indicating that electrophysiological responses were due to glutamatergic transmission. cc: corpus callosum.
Figure 1
Figure 1. Mating enhances low-frequency coherence across multiple brain areas
a, Cumulative huddling trajectories of hit and (c) non-hit subjects during cohabitation; huddling latencies are indicated by dots color-coded by subject. b, Huddling latency negatively correlates with total huddling duration over full cohabitation (n = 15; R = 0.63, P < 0.001). d, Coherence spectra for example hit and (g) non-hit subjects, with insets indicating low-frequency peaks during mating (5 Hz). Solid lines and shaded regions show mean and mid-95 percentile range, respectively, of the n = 40 coherence estimates for a given behavior (see Methods). e, 5 Hz coherence is significantly modulated by behavior in both hits (F2, 16 = 35.10, P < 0.001; post-hoc, M vs. SG, t8 = 4.65, P = 0.005; M vs. Hud, t8 = 6.73, P < 0.001; SG vs. Hud, t8 = 5.10, P = 0.003) and (f) non-hits (F2, 10 = 12.43, P = 0.002; post-hoc, M vs. SG, t5 = 2.44, P = 0.176; M vs. Hud, t5 = 4.08, P = 0.029; SG vs. Hud, t5 = 3.08, P = 0.082). Reported coherence P-values are Bonferroni-corrected for multiple comparisons (see Methods). Error bars show mean ± s.e.m. Image of huddling voles adapted from [17].
Figure 2
Figure 2. mPFC-NAcc cross-frequency coupling is dynamically modulated and behavior-dependent
a, Example raw LFP from mPFC (top) and NAcc (upper middle), filtered into low-frequency (lower middle) and gamma-frequency (bottom) bands, shows gamma amplitude modulation by low-frequency phase. b, Modulation Index (MI) of phase-amplitude coupling for example hit subject showing mPFC-to-NAcc (left) and NAcc-to-mPFC (middle) directions during cohabitation. “Net modulation” (right) is difference in MI between directions. c, Mean net modulation for hit (left, n = 9), non-hit (middle, n = 6), or pooled (right, n = 15) subjects shows peaks when mPFC low-frequency phase modulates NAcc (or non-hit) gamma amplitude (indicated by black rectangle). d, Net modulation values (2-s, non-overlapping windows) sampled over a baseline solo period (gold points) and 6-hr cohabitation for example hit and (g) non-hit subjects. Values that temporally overlap with mating, self-grooming and huddling behaviors (top hashes) are color-coded accordingly. All non-scored values are indicated as “other-cohab,” which together with mating and self-grooming represent “nonhuddling” values. e, Mean net modulation across subjects during huddling, baseline and nonhuddling behaviors in all hits and (f) non-hits. Net modulation varies with behavior in hits (F1.219, 9.754 = 9.44, P = 0.010, Greenhouse-Geisser corrected; post-hoc, NHud vs. B, t8 = 3.39, P = 0.028; NHud vs. Hud, t8 = 3.17, P = 0.040; Hud vs. B, t8 = 1.81, P = 0.322) but not non-hits (F1.027, 5.133 = 3.94, P = 0.102, Greenhouse-Geisser corrected). h, Nonhuddling and huddling net modulations are not correlated in either hits (R = 0.10, P = 0.417) or (i) non-hits (R = 0.06, P = 0.630). Reported P-values in e, f are Bonferroni-corrected for multiple comparisons (see Methods). Error bars show mean ± s.e.m.
Figure 3
Figure 3. mPFC-NAcc cross-frequency coupling correlates with huddling latency
a, Correlations between huddling latency and mean nonhuddling (NHud) net modulation during baseline, first 60 minutes and full cohabitation in hits (R = 0.51, P = 0.096; R= 0.74, P = 0.008; R = 0.76, P = 0.007, respectively) and (b) non-hits (R = 0.21, P > 0.99; R = 0.05, P > 0.99; R = 0.12, P > 0.99, respectively). Significant correlations occur for hits at 60 minutes and full cohabitation. c, Correlation strength (R) between huddling latency and mean NHud net modulation increases for larger time windows from start of cohabitation in hits (squares) but not non-hits (triangles). Shaded regions and dashed bars indicate range and median of latencies to first mating (purple) and self-grooming (green) across all subjects (n = 15). d, Mean net modulation values within 1 min moving windows (stepped by 0.1 min) before (M-) and after (M+) the first mating bout of hits and (k) non-hits. Each subject's values are color-coded by that subject's latency to huddle from the end of the mating bout (latencyM+). e, Change in mean net modulation from immediately before to after the first mating bout (indicated by line segments in d) negatively correlates with huddling latencyM+ in hits (R = 0.72, P = 0.004) but not (j) non-hits (R = 0.02, P = 0.766; line segments in k). f, Strength of correlation between mean net modulation and huddling latencyM+ increases from before to after mating and is sustained for ∼2 min in hits but not (m) non-hits. g, h, This increase in hits is maintained, and significant (P = 0.002, permutation test on difference in R (0.75) between bracketed time points), when subtracting out the mean baseline net modulation from the local values around mating. (l, o) Non-hits show no significant increase in correlation strength (P = 0.233, observed R difference of 0.39). i, Change in mean net modulation from immediately before to after first mating bout correlates with mean NHud net modulation in the 15 min after mating in hits (R = 0.84, P < 0.001) but not (n) non-hits (R = 0.58, P = 0.080). All mating results in hit subjects (e, h, i) remain significant even without Subject 4 (black dot, n = 8). Reported P-values in a, b are Bonferroni-corrected for multiple comparisons (see Methods).
Figure 4
Figure 4. Low-frequency stimulation of mPFC-to-NAcc projections biases behavioral preference towards a partner
Example immunohistochemistry showing a, ChR2 expression in mPFC (injection site, top image) and b, fibers projecting to NAcc (stimulation site; middle and bottom images; bottom image is magnified view of boxed area). ChR2 tagged with enhanced yellow fluorescent protein (EYFP) for visualization. DAPI counterstain shows cell nuclei. c, Light-evoked excitatory post-synaptic currents in example putative NAcc medium spiny neuron during whole-cell patch recording in presence of Picrotoxin (Picro; top). Excitatory transmission confirmed using AMPA/kainate receptor antagonist 6,7-dinitroquinoxaline-2,3-dione (DNQX; bottom). Top and bottom traces each represent average response to n = 5 light-pulse trains at 5 Hz (see Methods). d, (Top) total optical stimulation and (bottom) time spent in each zone during cohabitation do not significantly differ between ChR2-expressing (n = 12) and control subjects (expressing EYFP only, n = 10; one subject missing due to data loss during cohabitation) (Stim, Cohen's d = 0.46, P = 0.298; Social, d = 0.41, P = 0.345; Neutral, d = 0.20, P = 0.698; Non-social, d = 0.68, P = 0.102). e, (Top) time spent with partner (P) versus stranger (S) during PPT for ChR2 (n = 12) and EYFP (n = 11) subjects. (Bottom) ChR2 subjects spent significantly greater relative time with the partner compared to stranger (d = 0.94, P = 0.034). Boxplots show median and interquartile range. Data points indicated by red cross refer to values whose distance from top or bottom of the box is greater than 1.5 times the interquartile range. Cg1: anterior cingulate cortex (area 1); PL: prelimbic cortex.

References

    1. Hazan C, Shaver P. Romantic love conceptualized as an attachment process. J Pers Soc Psychol. 1987;52:511–524. - PubMed
    1. Bartels A, Zeki S. The neural basis of romantic love. Neuroreport. 2000;11:3829–3834. - PubMed
    1. Young LJ, Lim MM, Gingrich B, Insel TR. Cellular mechanisms of social attachment. Horm Behav. 2001;40:133–138. - PubMed
    1. Aragona BJ, et al. Nucleus accumbens dopamine differentially mediates the formation and maintenance of monogamous pair bonds. Nat Neurosci. 2006;9:133–139. - PubMed
    1. Ross HE, et al. Variation in oxytocin receptor density in the nucleus accumbens has differential effects on affiliative behaviors in monogamous and polygamous voles. J Neurosci. 2009;29:1312–1318. - PMC - PubMed

Publication types