. 2017 Jul;35(7):659-666.
doi: 10.1038/nbt.3906. Epub 2017 May 31.

Guided self-organization and cortical plate formation in human brain organoids

Affiliations

Guided self-organization and cortical plate formation in human brain organoids

Madeline A Lancaster et al. Nat Biotechnol. 2017 Jul.

Erratum in

Abstract

Three-dimensional cell culture models have either relied on the self-organizing properties of mammalian cells or used bioengineered constructs to arrange cells in an organ-like configuration. While self-organizing organoids excel at recapitulating early developmental events, bioengineered constructs reproducibly generate desired tissue architectures. Here, we combine these two approaches to reproducibly generate human forebrain tissue while maintaining its self-organizing capacity. We use poly(lactide-co-glycolide) copolymer (PLGA) fiber microfilaments as a floating scaffold to generate elongated embryoid bodies. Microfilament-engineered cerebral organoids (enCORs) display enhanced neuroectoderm formation and improved cortical development. Furthermore, reconstitution of the basement membrane leads to characteristic cortical tissue architecture, including formation of a polarized cortical plate and radial units. Thus, enCORs model the distinctive radial organization of the cerebral cortex and allow for the study of neuronal migration. Our data demonstrate that combining 3D cell culture with bioengineering can increase reproducibility and improve tissue architecture.


Conflict of interest statement

Declaration of competing financial interests

M.A.L. and J.A.K. have filed a patent application for use of this technology in future disease modeling and toxicology testing.

Figures
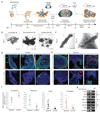
Figure 1
Figure 1. Engineered cerebral organoids reproducibly generate elongated neuroepithelium
a. Schematic of the method for generating engineered cerebral organoids (enCORs). Timeline and media used (methods) are shown at the bottom. Specific timing should be tailored to the developing morphology of the tissue as detailed in methods. b. PSCs attach to and coat the PLGA microfilaments (left panel, arrowheads) as well as fibers derived from sea-sponge (middle panel), whereas cellulose fibers with similar dimensions (right panel) fail to form elongated EBs at day 3 with H9 cells, and instead remain as clumps (arrows) only partially attached to the fibers. c. Bioengineered EBs from H9 cells at two time points, day 8 and 11, during neural induction, showing clearing along the edges and polarized neural ectoderm (arrows). d. Immunohistochemical staining of day 10 bioengineered H9 EBs for the germ layer markers Brachyury for mesoderm, N-Cadherin for neural ectoderm, Sox17 for endoderm, and E-Cadherin for non-neural epithelium. Note the prevalence of polarized neural epithelia (arrows) displaying the apical domain on the surface (white asterix) with only occasional other germ layer identities (arrowhead). The microfilament can be seen as an autofluorescent rod (yellow asterix). e. Immunohistochemical staining of day 10 H9 spheroids for the same germ layer markers. Again, note the polarized neural epithelia (arrows) displaying the apical domain on the surface (white asterix) on an optimal brain organoid (upper left panel), while extensive mesoderm and endoderm identities (arrowheads) are visible in suboptimal organoids. f. Quantification of fluorescence staining of the above markers (mean grey value relative to DAPI). Dot-plot, mean ± SD. *P<0.05, Student’s two-tailed t-test, n = 6-10 spheroids (10-day, H9), n = 4 enCOR organoids (10-day, H9). g. RT-PCR for expression of markers of the three germ layers: Neuroectoderm (NE), mesoderm (ME), and endoderm (EN) in 20-day microfilament organoids and organoids lacking a filament (spherical organoids) both made from H9 cells. Neg. is the negative water control. Images are cropped from full length gels shown in Supplementary Fig. 3b. Scale bars: 500 μm in b., 250 μm in c., 100 μm in d., e.
Figure 2
Figure 2. enCORs show increased forebrain identity
a. Haematoxylin and eosin (H&E) staining of representative 40-day spherical and enCOR organoids from H9 cells. Spheroids contain lobes of brain tissue (arrows) but also non-neural regions such as fluid-filled cysts and fibrous regions (arrowheads). enCORs instead contain pure neural tissue and many large continuous lobes of brain tissue (arrows). b. Representative sections of whole 40-day H9 organoids stained for the forebrain marker Foxg1. enCORs display increased numbers of Foxg1+ lobes (arrows) compared with spheroids. c. Quantification of the mean ratio of individual lobes displaying positive staining for the specified regional markers (see Supplementary Fig. 4e for representative stained sections). Foxg1 positive regions represent forebrain, regions highly positive for Otx2 represent midbrain, En2 positive regions represent cerebellar or hindbrain identities. Error bars are S.E.M. *P<0.01, **P<0.0001, Student’s two-tailed t-test, n = 8 spheroids (40-day, H9) from three independent batches, n = 11 enCOR organoids (40-day, H9) from four independent batches. d. Staining of day 40 H9 enCOR brain organoids and spheroids for the markers of dorsal cortex Tbr1 and Tbr2 reveals large lobes of tissue that are dorsal cortex (arrows) in enCORs. Spheroids show much fewer dorsal regions and some large brain regions that lack this identity (arrowhead). e. Heatmap of Spearman correlation coefficients of differentially expressed genes at 60 days in H9 spheroids and enCORs with the Allen BrainSpan transcriptome. All brain regions are shown for stage I (8-9 post-conception weeks, see Supplementary Fig. 7c), sorted by anterior-posterior regional identity. Scale bars: 500 μm in a., b., d.
Figure 3
Figure 3. enCORs with reconstituted basement membrane form cortical plate
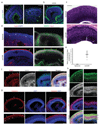
a. Staining for the basement membrane component laminin (green) in a day 48 H9 spheroid. Note the presence of the basement membrane surrounding a region of early neuroepithelium before the generation of neurons (first panel, arrow), whereas another, more developed region displays neuron generation and only sparse laminin labeling remains (arrowheads) adjacent to the ventricular zone (VZ, brackets) rather than over the surface of the organoid. b. Laminin staining of a 60-day H9 enCOR following treatment with dissolved extracellular matrix (ECM) in the form of Matrigel. Note the presence of a laminin-rich basement membrane covering the surface of the organoid (arrow) and outside both the VZ (bracket) and newly generated neurons. c. Histological staining by H&E reveals the presence of a radially oriented dense CP (bracket) in enCORs with ECM, in contrast to the disorganized neurons of a spheroid. Both are 60-day H9 derived organoids. d. Immunohistochemical staining for laminin and the neuronal markers MAP2 and Ctip2 in day-60 H9 spheroid and enCOR. Note the presence of remnant basement membrane in the spheroid (arrowheads), whereas in the enCOR with ECM a basement membrane (white arrows) forms outside the dense Ctip2+ cortical plate (yellow arrows). e. Quantification of the mean ratio of individual lobes displaying a CP in H&E stained sections of day-60 H9 organoids. Individual lobes were identified by the presence of a ventricular space and radial VZ. CP was identified by the presence of a condensed band separated from the VZ by a cell-sparse zone. Each point is an independent batch of 2-3 organoids, each with several lobes of brain tissue. n = 4 independent batches of 12 spheroids, n = 5 independent batches of 12 enCORs. Mean across batches shown ± SD. f. Staining for Reelin in a dorsal cortical region early in CP formation (day-56 H9 enCOR). Several cells, which are strongly reactive for Reelin (arrows), localize outside the newly forming CP (arrowheads, recognizable by the lower intensity Map2 staining), consistent with Cajal-Retzius identity. Staining can also be seen more diffusely, consistent with its secreted role. g. Staining for calretinin, another marker of Cajal-Retzius cells, in a day-53 H9 enCOR, labels cells outside (arrows) the newly forming CP. Note the gradient of CP formation with more advanced CP to the left (bracket), and the initiation to the right (asterisk). Where the CP is further developed, one can also observe calretinin+ cells internal (arrowheads) to the CP, consistent with preplate splitting, and interneuron identity. h. Staining for chondroitin sulfate proteoglycan (CSPG) in day-68 H9 enCORs further demonstrates preplate splitting. Panels on the left show a less developed CP (yellow brackets) with the initiation of splitting and SP formation (white brackets with asterisk), while panels on the right show a more developed CP with layers consistent with SP, CP, and MZ. Scale bars: 100 μm in all panels.
Figure 4
Figure 4. enCORs display radial units and radial neuronal migration.
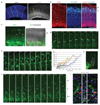
a. Nuclear staining by DAPI in a 60-day H9 enCOR reveals radially organized units (dashed lines) while sparse staining for radial glial fibers with the marker of mitotic radial glia phosphorylated vimentin reveals fibers that extend the width of the tissue (arrowheads) reminiscent of a radial scaffold. b. Nestin staining for radial glia in day-70 H1 enCORs reveals long basal processes (arrowheads) that terminate with end feet at the surface of the organoid (asterisks) outside the CP and MZ. c. Electroporation of the VZ of a 64-day H9 enCOR with a GFP construct and vibratome sectioning the next day reveals individual RG basal processes (arrows) that extend to the outer surface (asterisks). d. Frames from live imaging of an outer/basal RG (arrow marks the cell body) in a H1 enCOR electroporated with GFP on day 63, followed by vibratome sectioning four days later and live imaging 24-hours later (Supplementary Video 1). Note the long basal process (arrowheads) and endfoot (asterisk) as well as a division event including mitotic somal translocation beginning at 21:40. The newly generated daughter cell (blue arrow) then extends a process apically (blue arrowheads). Time stamp is hours:minutes. e. Frames from live imaging (Supplementary Video 5) of a membrane targeted farnesyl-GFP labeled neuron (arrowhead) showing radial migration into the CP. Time stamp is hours:minutes. f. Live imaging of migration of several neurons (arrowheads) in the same sample as d., displaying typical radial migration including transient stalling with multipolar morphology (for example blue arrowhead 11:40 to 23:00). Stills taken from Supplementary Video 1. Colors of the arrowheads match traces shown in g. and h. Time stamp is hours:minutes. g. Traces of distance traveled of 22 individual neurons from Supplementary Videos 1, 2, and 4. Colors of the traces match those shown in h. Note the characteristic transient stalling in several of the traces (red, blue, purple) with shorter duration stalling in the green and brown traces, while the light blue trace is already stalled at the start of the movie. h. Movement traces of individual neurons quantified in g. and shown in f. showing the movement into the intermediate zone with stalling and subsequent movement into the CP. i. Individual neurons labeled by electroporation of an H9 enCOR at day 64 with an integrating farnesylated GFP construct to allow for long-term labeling and analysis after 36 days. Note the primary dendrite extending from the cell body (arrows) toward the outer surface (dashed lines), as well as many parallel fibers (arrowheads) in the outer MZ. Scale bars: 100 μm in a., b., c., h., 50 μm in d., f., 20 μm in e., i.

Comment in

References

    1. Rookmaaker MB, Schutgens F, Verhaar MC, Clevers H. Development and application of human adult stem or progenitor cell organoids. Nature Reviews Nephrology. 2015;11:546–554. - PubMed
    1. Fatehullah A, Tan SH, Barker N. Organoids as an in vitro model of human development and disease. Nat Cell Biol. 2016;18:246–254. - PubMed
    1. Yin X, et al. Engineering Stem Cell Organoids. Cell Stem Cell. 2016;18:25–38. - PMC - PubMed
    1. Dedhia PH, Bertaux-Skeirik N, Zavros Y, Spence JR. Organoid Models of Human Gastrointestinal Development and Disease. Gastroenterology. 2016;0 - PMC - PubMed
    1. Sasai Y. Next-Generation Regenerative Medicine: Organogenesis from Stem Cells in 3D Culture. Cell Stem Cell. 2013;12:520–530. - PubMed

MeSH terms