Drivers of abundance and spatial distribution of reef-associated sharks in an isolated atoll reef system
- PMID: 28562602
- PMCID: PMC5451018
- DOI: 10.1371/journal.pone.0177374
Drivers of abundance and spatial distribution of reef-associated sharks in an isolated atoll reef system
Erratum in
-
Correction: Drivers of abundance and spatial distribution of reef-associated sharks in an isolated atoll reef system.PLoS One. 2017 Oct 12;12(10):e0186560. doi: 10.1371/journal.pone.0186560. eCollection 2017. PLoS One. 2017. PMID: 29023531 Free PMC article.
Abstract
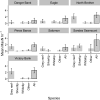
We investigated drivers of reef shark demography across a large and isolated marine protected area, the British Indian Ocean Territory Marine Reserve, using stereo baited remote underwater video systems. We modelled shark abundance against biotic and abiotic variables at 35 sites across the reserve and found that the biomass of low trophic order fish (specifically planktivores) had the greatest effect on shark abundance, although models also included habitat variables (depth, coral cover and site type). There was significant variation in the composition of the shark assemblage at different atolls within the reserve. In particular, the deepest habitat sampled (a seamount at 70-80m visited for the first time in this study) recorded large numbers of scalloped hammerhead sharks (Sphyrna lewini) not observed elsewhere. Size structure of the most abundant and common species, grey reef sharks (Carcharhinus amblyrhynchos), varied with location. Individuals at an isolated bank were 30% smaller than those at the main atolls, with size structure significantly biased towards the size range for young of year (YOY). The 18 individuals judged to be YOY represented the offspring of between four and six females, so, whilst inconclusive, these data suggest the possible use of a common pupping site by grey reef sharks. The importance of low trophic order fish biomass (i.e. potential prey) in predicting spatial variation in shark abundance is consistent with other studies both in marine and terrestrial systems which suggest that prey availability may be a more important predictor of predator distribution than habitat suitability. This result supports the need for ecosystem level rather than species-specific conservation measures to support shark recovery. The observed spatial partitioning amongst sites for species and life-stages also implies the need to include a diversity of habitats and reef types within a protected area for adequate protection of reef-associated shark assemblages.
Conflict of interest statement
Figures


Similar articles
-
Depth and benthic habitat influence shallow and mesophotic predatory fishes on a remote, high-latitude coral reef.PLoS One. 2022 Mar 24;17(3):e0265067. doi: 10.1371/journal.pone.0265067. eCollection 2022. PLoS One. 2022. PMID: 35324946 Free PMC article.
-
Quantifying shark distribution patterns and species-habitat associations: implications of marine park zoning.PLoS One. 2014 Sep 10;9(9):e106885. doi: 10.1371/journal.pone.0106885. eCollection 2014. PLoS One. 2014. PMID: 25207545 Free PMC article.
-
Reef sharks exhibit site-fidelity and higher relative abundance in marine reserves on the Mesoamerican Barrier Reef.PLoS One. 2012;7(3):e32983. doi: 10.1371/journal.pone.0032983. Epub 2012 Mar 8. PLoS One. 2012. PMID: 22412965 Free PMC article.
-
Larval dispersal and movement patterns of coral reef fishes, and implications for marine reserve network design.Biol Rev Camb Philos Soc. 2015 Nov;90(4):1215-47. doi: 10.1111/brv.12155. Epub 2014 Nov 25. Biol Rev Camb Philos Soc. 2015. PMID: 25423947 Review.
-
Habitat-use of the vulnerable Atlantic Nurse Shark: a review.PeerJ. 2023 Jun 15;11:e15540. doi: 10.7717/peerj.15540. eCollection 2023. PeerJ. 2023. PMID: 37337585 Free PMC article. Review.
Cited by
-
The Sharklogger Network-monitoring Cayman Islands shark populations through an innovative citizen science program.PLoS One. 2025 May 9;20(5):e0319637. doi: 10.1371/journal.pone.0319637. eCollection 2025. PLoS One. 2025. PMID: 40344080 Free PMC article.
-
Protection from illegal fishing and shark recovery restructures mesopredatory fish communities on a coral reef.Ecol Evol. 2019 Aug 20;9(18):10553-10566. doi: 10.1002/ece3.5575. eCollection 2019 Sep. Ecol Evol. 2019. PMID: 31624567 Free PMC article.
-
Correction: Drivers of abundance and spatial distribution of reef-associated sharks in an isolated atoll reef system.PLoS One. 2017 Oct 12;12(10):e0186560. doi: 10.1371/journal.pone.0186560. eCollection 2017. PLoS One. 2017. PMID: 29023531 Free PMC article.
-
Evaluating techniques for determining elasmobranch body size: a review of current methodologies.PeerJ. 2024 Dec 23;12:e18646. doi: 10.7717/peerj.18646. eCollection 2024. PeerJ. 2024. PMID: 39726740 Free PMC article. Review.
-
Remote submerged banks and mesophotic ecosystems can provide key habitat for endangered marine megafauna.Sci Adv. 2024 Feb 23;10(8):eadl2838. doi: 10.1126/sciadv.adl2838. Epub 2024 Feb 21. Sci Adv. 2024. PMID: 38381823 Free PMC article.
References
-
- Levi T, Wilmers CC. Wolves-coyotes-foxes: a cascade among carnivores. Ecology. 2012;93: 921–929. - PubMed
-
- Beschta RL, Ripple WJ. Recovering Riparian Plant Communities with Wolves in Northern Yellowstone, U.S.A. Restoration Ecology. 2008;18: 380–389.
-
- Terborgh J, Estes JA. Trophic Cascades. Terborgh J, Estes JA, editors. Washington, DC: Island Press; 2010.
-
- Shurin JB, Gruner DS, Hillebrand H. All wet or dried up? Real differences between aquatic and terrestrial food webs. Proc Biol Sci. 2006;273: 1–9. doi: 10.1098/rspb.2005.3377 - DOI - PMC - PubMed
-
- Thompson RM, Hemberg M, Starzomski BM, Shurin JB. Trophic levels and trophic tangles: the prevalence of omnivory in real food webs. Ecology. 2007;88: 612–617. - PubMed
MeSH terms
LinkOut - more resources
Full Text Sources
Other Literature Sources

