. 2017 May 30;19(9):1940-1952.
doi: 10.1016/j.celrep.2017.05.018.

Effect of Human Genetic Variability on Gene Expression in Dorsal Root Ganglia and Association with Pain Phenotypes

Affiliations

Effect of Human Genetic Variability on Gene Expression in Dorsal Root Ganglia and Association with Pain Phenotypes

Marc Parisien et al. Cell Rep. .

Abstract

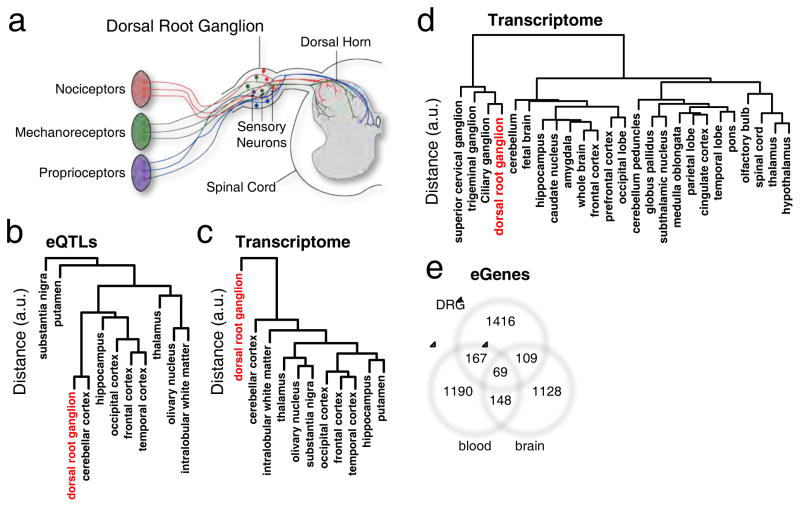
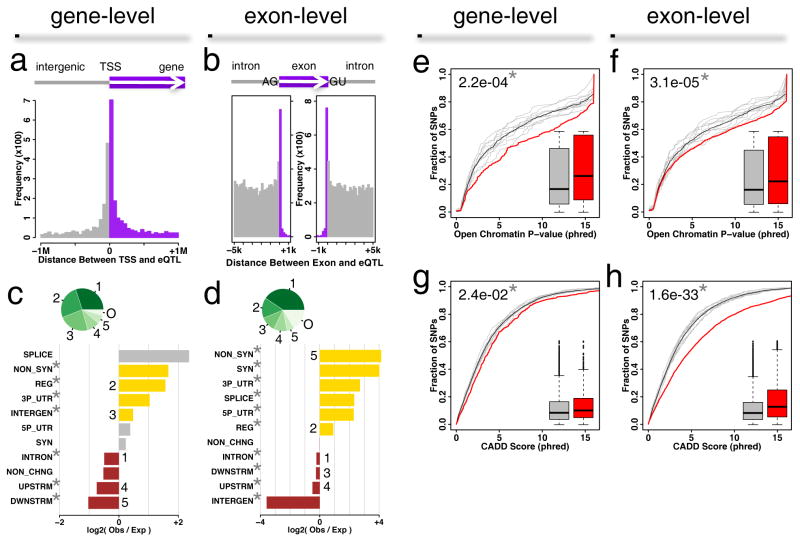
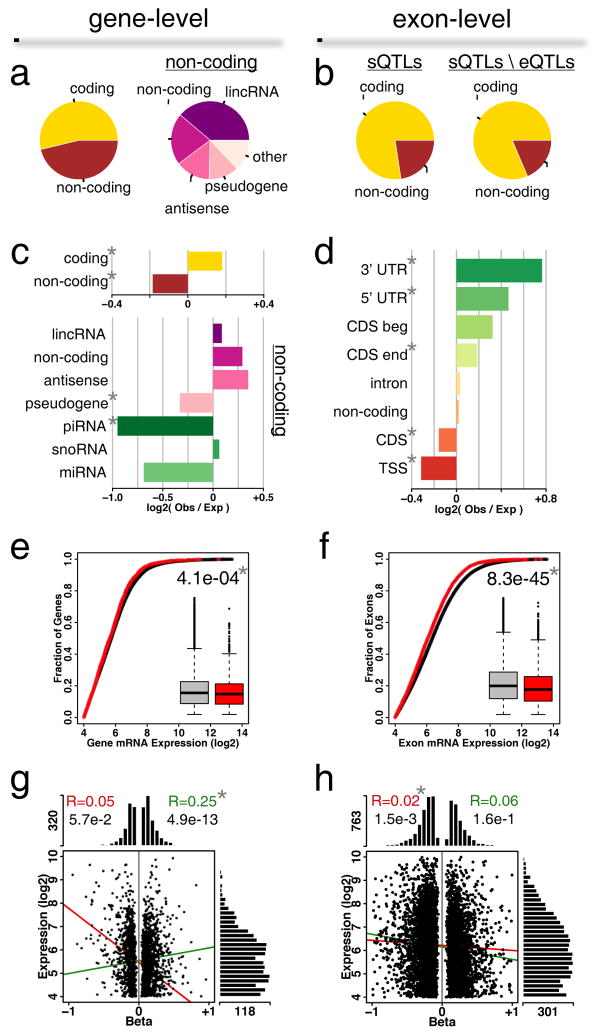
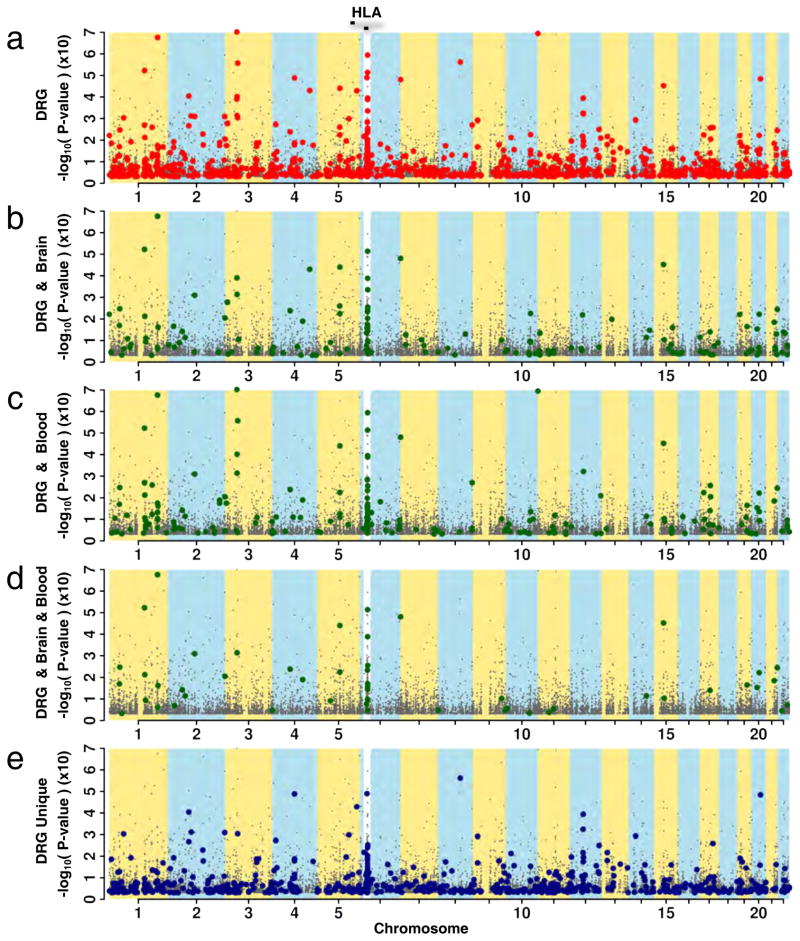
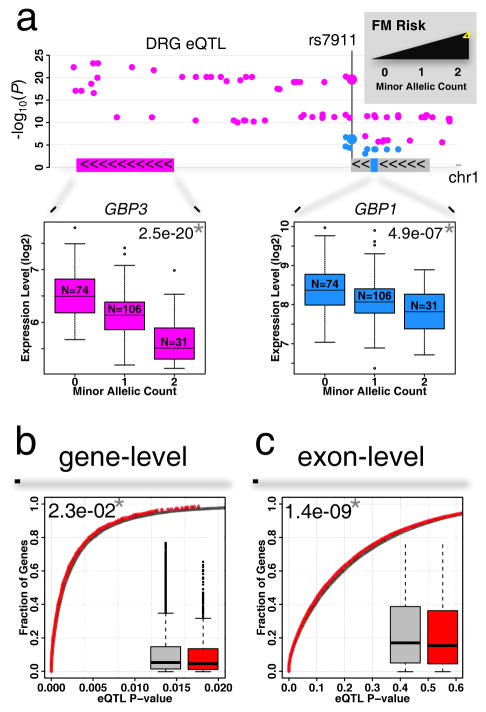
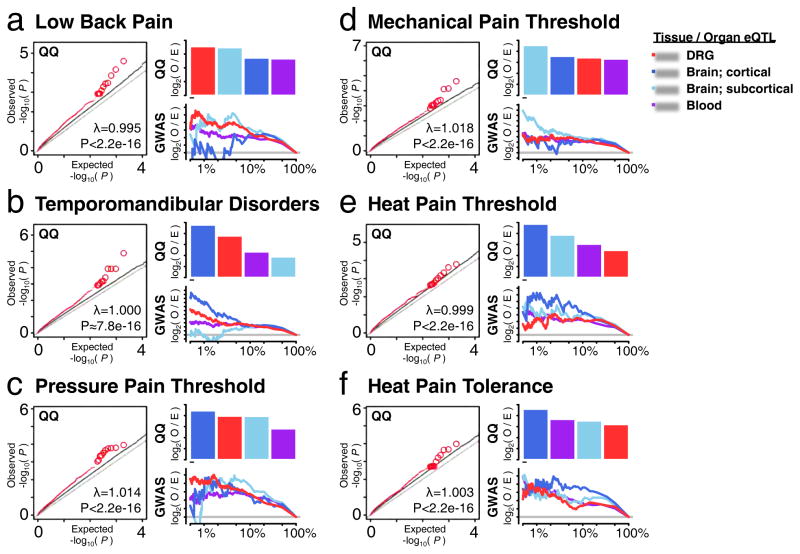
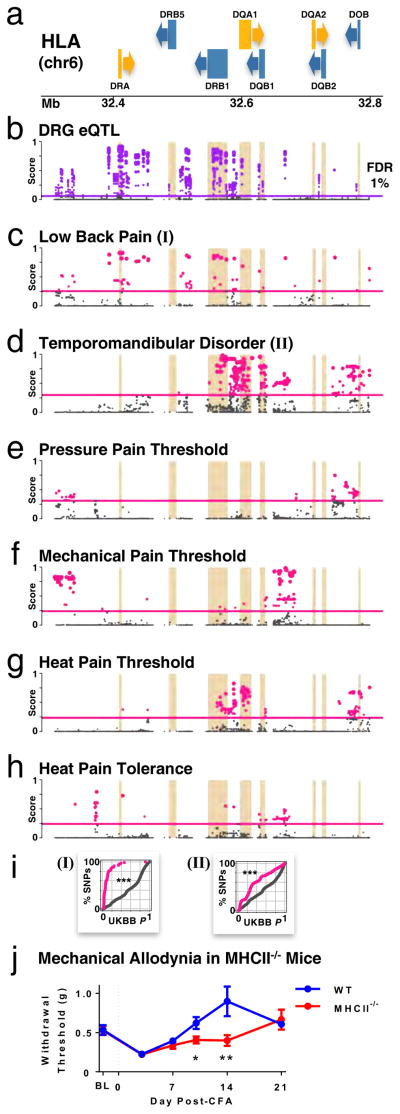
Dorsal root ganglia (DRG) relay sensory information to the brain, giving rise to the perception of pain, disorders of which are prevalent and burdensome. Here, we mapped expression quantitative trait loci (eQTLs) in a collection of human DRGs. DRG eQTLs were enriched within untranslated regions of coding genes of low abundance, with some overlapping with other brain regions and blood cell cis-eQTLs. We confirm functionality of identified eQTLs through their significant enrichment within open chromatin and highly deleterious SNPs, particularly at the exon level, suggesting substantial contribution of eQTLs to alternative splicing regulation. We illustrate pain-related genetic association results explained by DRG eQTLs, with the strongest evidence for contribution of the human leukocyte antigen (HLA) locus, confirmed using a mouse inflammatory pain model. Finally, we show that DRG eQTLs are found among hits in numerous genome-wide association studies, suggesting that this dataset will help address pain components of non-pain disorders.

Keywords: DRG; GWAS; QST; SNPs; dorsal root ganglion; eQTLs; expression quantitative trait loci; genome-wide association study; pain; quantitative sensory testing; single nucleotide polymorphism.


Conflict of interest statement

COMPETING FINANCIAL INTERESTS

The authors declare no competing financial interests.

Figures

Figure 1
Figure 1
Comparative analysis of DRG transriptome and cis-eQTLs. (a) Spinal cord and DRG anatomy. (b) Unsupervised hierarchical clustering of DRG (red) cis-eQTLs or (c) DRG (red) transcriptome with 10 brain regions (braineac dataset). (d) Unsupervised hierarchical clustering of transcriptomes between various tissue types of the central and peripheral nervous system (Harvard dataset), including dorsal root ganglia (red). (e) 3-way Venn diagram showing the extent of shared eGenes across DRGs, whole blood and a mixture of 10 brain tissues. See also Figures S1 to S5, and Tables S1 to S3.
Figure 2
Figure 2
Characterization of cis-eQTLs in DRGs. (a) Histogram of the distance between cis-eQTL and the transcription start site (TSS) of the associated eGene. Grey is intergenic and purple is intragenic regions. (b) Histogram of the distance between cis-eQTL and the associated exon. Grey is intronic and purple is exonic regions. (c) Functional annotation of gene-level or (d) exon-level cis-eQTLs. Horizontal barplots track enrichment as log-ratios of observed to expected counts. Positive enrichment (yellow) signifies counts that are higher than expected, while negative enrichment (brown) signifies counts that are lower than expected. Observed counts less than ten may not be reliable (grey). Counts are binned by categories, defined by the CADD web resource. Categories are synonymous (SYN), non-synonymous (NON_SYN), 5′UTR (5P_UTR), 3′UTR (3P_UTR), splice site (SPLICE), regulatory (REG), intron (INTRON), upstream (UPSTRM), downstream (DWNSTRM), intergenic (INTERGEN), and non-coding change (NON_CHNG). Pie charts (green shades) track the relative counts per categories, labeled from 1 to 5, and others “0” combining the remaining categories. Categories marked with a star * pass Bonferroni correction following a binomial test for enrichment of observed over expected. Open chromatin evidence at gene-level (e) or exon-level (f) cis-eQTLs from the ENCODE project. A cumulative distribution function tracks the fraction of SNPs as a function of phred-based P-values for evidence of open chromatin. DRG eQTLs (red) are contrasted against 10 discrete SNPsnap background distributions (grey), and their combined averaged background (black). In inset, a box-and-whisker plot shows the distributions of the phred-based scores for DRG (red) and averaged background (grey). U-test P-value between these distributions is also shown (upper left). A star * indicates Bonferroni-corrected statistical significance. (g) SNP’s deleterious index for gene-level or (h) exon-level cis-eQTLs. A cumulative distribution function tracks the fraction of SNPs as a function of phred-based CADD scores. Deleteriousness is estimated to be proportional to phred-based CADD scores. The background distribution is the same as in e or f, respectively.
Figure 3
Figure 3
Characterization of eGenes in DRGs. (a) Classes of genes associated at gene-level or (b) exon-level. Pie charts track the relative counts per category. sQTL refers to splicing eQTL; total sQTLs genes classes (left) are compared with the sQTLs classes resulting from the removal of those that are also eQTLs (right). (c) Gene class enrichment for gene-level associations. Horizontal barplots represent enrichment of log-ratios of observed counts to expected counts. (d) Exon class enrichment for exon-level associations. Classes are 5′UTR, 3′UTR, coding sequence (CDS) beginning (CDS beg) and ending (CDS end), intron, transcription start site (TSS), pre-TSS, and non-coding. (e) Expression levels for all genes versus eGenes at gene-level or (f) exon-level. Shown insets are box-and-whisker plots for all genes (grey) or eGenes (red). U-test P-value between the two distributions is shown. (g) Relationship between expression level and cis-eQTL effect size (beta) for gene-level or (h) exon-level associations. Histograms show the distribution of scattered points along the two main axes. Lines show correlations between expression levels and beta (positive beta, green; negative beta, red). Pearson’s correlation coefficient values are indicated at the top. In all panels, a star * indicates statistical significance after Bonferroni correction for gene classes following a binomial test for enrichment of observed over expected.
Figure 4
Figure 4
Contribution of DRG eQTLs to human diseases. Manhattan plots show association for cis-acting DRG eQTLs at gene- and exon-level. SNPs from the NHGRI catalog reported to be associated with human diseases are highlighted. Strips of alternative yellow/blue colors bring out chromosome loci, while white strips emphasize the Human Leukocyte Antigen locus (HLA; 10x magnification). (a) NHGRI SNPs overlapping with DRG eQTLs are highlighted in red. (b–d) NHGRI SNPs overlapping with shared eQTLs between DRG and other tissues are highlighted in green where eQTLs are shared by (b) DRG and brain, (c) DRG and blood, (d) DRG, brain and blood. (e) Non-overlapping eQTLs unique to DRG in blue. See also Table S4.
Figure 5
Figure 5
Contribution of DRG eQTLs to gene-candidates association results with pain phenotypes. (a) Manhattan plot of DRG eQTLs in the GBP genes cluster. The minor allele for SNP rs7911 has been previously associated with increased risk for FM. The same SNP is also an eQTL at gene-level for GBP3 (magenta), and at exon-level for GBP1 (blue). Color-coded insets show gene and exon expression level change as a function of minor allele count. A star (*) indicates statistical significance for reported P-values. (b) Cumulative distribution function of cis-eQTL P-values for all genes (grey) is compared with that of reported pain genes (red) at gene-level or (c) at exon-level. Box-and-whisker plots show difference in P-value distributions. See also Tables S5 and S6.
Figure 6
Figure 6
Contribution of DRG eQTLs to GWAS results with pain phenotypes. QQ plots (left) depict that DRG eQTLs (red) show significant enrichment for SNPs associated with pain phenotypes relative to all SNPs (gray). Barplots (right, QQ) depict relative contributions of tissue-specific eQTLs to associated phenotype. Tissue contribution is measured as the sum of log2 of QQ plot’s observed to expected ratio for the best 50 eQTLs in that tissue. Curves (right, GWAS) depict enrichment of tissue-specific eQTLs found in the top-ranking GWAS hits. The enrichment is the log2 of observed q/n ratio to the expected Q/N ratio, where q is the observed number of tissue-specific eQTLs in the top n GWAS hits, out of a total Q tissue-specific eQTLs in the total N GWAS hits. Horizontal grey line show no enrichment threshold (i.e. O ~ E, or log2(1)=0). The tested phenotypes are: (a) Low Back Pain; (b) Temporomandibular Disorders; (c) pressure pain threshold; (d) mechanical pain threshold; (e) heat pain threshold; (f) heat pain tolerance.
Figure 7
Figure 7
Associations of HLA gene locus for DRG eQTLs and pain phenotypes, and role in a mouse inflammatory pain model. Dot plots track strength of the association of each SNP along the HLA locus in chromosome 6, with higher scores show stronger association with selected phenotype. Horizontal lines mark the genome-wide statistical threshold of significance at FDR 1%. (a) HLA genes, with arrows indicating the direction of transcription for each gene (forward, yellow; reverse, blue). Footprints of HLA genes are also underlined in other panels. (b) DRG eQTLs. (c–h) pain phenotypes: (c) LBP; (d) TMD; (e) pressure pain threshold in epicondyle; (f) mechanical pain threshold; (g) heat pain threshold; (h) heat pain tolerance. (i) Replication in the UK BioBank cohort for (I) back pain; and (II) facial pain. Plots show cumulative percentage of SNPs as a function of increasing replicative P-values, for SNPs whose eQTL/GWAS OPPERA discovery score is above statistical significance (FDR 1%; pink) and those below (grey). Kolmogorov-Smirnov test between the two curves; *** P < 2e-16. (j) Prolongation of mechanical allodynia in MHCII−/− mice in the CFA inflammatory pain model. Mechanical threshold was measured as 50% withdrawal threshold with von Frey filaments at baseline (BL) before, and 3, 7, 10, 14 and 21 days after CFA injection (dashed line) in the hindpaw of wild type (WT, blue) and MHCII−/− (red) mice. Data are presented as mean +/− s.e.m. * P ≤ 0.05; ** P ≤ 0.01 compared with WT mice. See also Table S7.

References

    1. Aneiros-Guerrero A, Lendinez AM, Palomares AR, Perez-Nevot B, Aguado L, Mayor-Olea A, Ruiz-Galdon M, Reyes-Engel A. Genetic polymorphisms in folate pathway enzymes, DRD4 and GSTM1 are related to temporomandibular disorder. BMC medical genetics. 2011;12:75. - PMC - PubMed
    1. Anttila V, Stefansson H, Kallela M, Todt U, Terwindt GM, Calafato MS, Nyholt DR, Dimas AS, Freilinger T, Muller-Myhsok B, et al. Genome-wide association study of migraine implicates a common susceptibility variant on 8q22.1. Nat Genet. 2010;42:869–873. - PMC - PubMed
    1. Benita Y, Cao Z, Giallourakis C, Li C, Gardet A, Xavier RJ. Gene enrichment profiles reveal T-cell development, differentiation, and lineage-specific transcription factors including ZBTB25 as a novel NF-AT repressor. Blood. 2010;115:5376–5384. - PMC - PubMed
    1. Birney E, Stamatoyannopoulos JA, Dutta A, Guigo R, Gingeras TR, Margulies EH, Weng Z, Snyder M, Dermitzakis ET, Thurman RE, et al. Identification and analysis of functional elements in 1% of the human genome by the ENCODE pilot project. Nature. 2007;447:799–816. - PMC - PubMed
    1. Carvalho BS, Irizarry RA. A framework for oligonucleotide microarray preprocessing. Bioinformatics. 2010;26:2363–2367. - PMC - PubMed

Publication types