

Hepatoprotective activity of chrysin is mediated through TNF-α in chemically-induced acute liver damage: An in vivo study and molecular modeling
- PMID: 28565752
- PMCID: PMC5443293
- DOI: 10.3892/etm.2017.4181
Hepatoprotective activity of chrysin is mediated through TNF-α in chemically-induced acute liver damage: An in vivo study and molecular modeling
Abstract
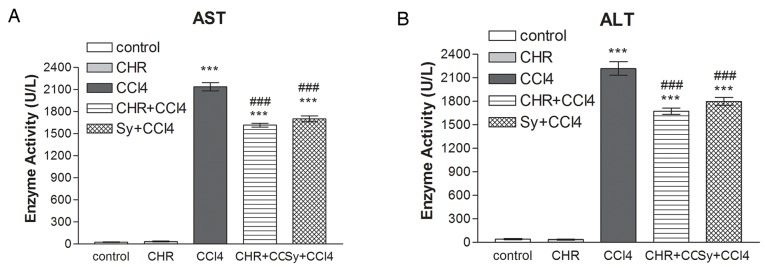
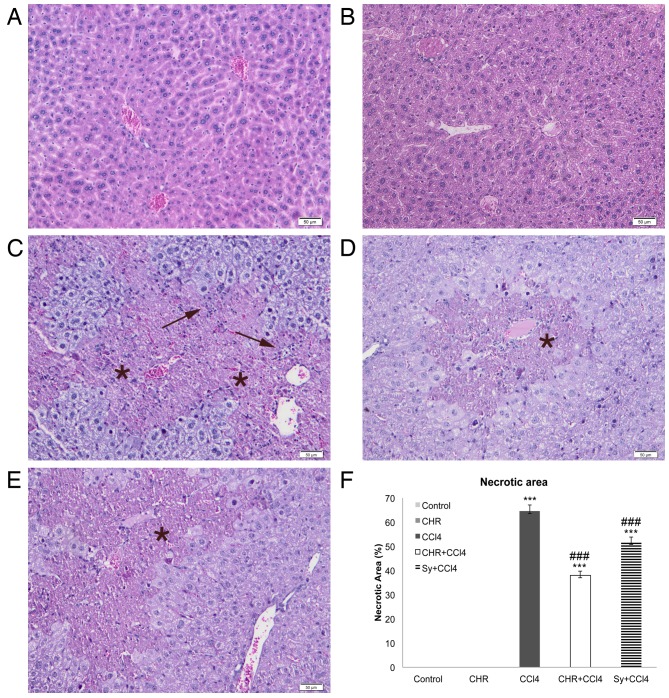
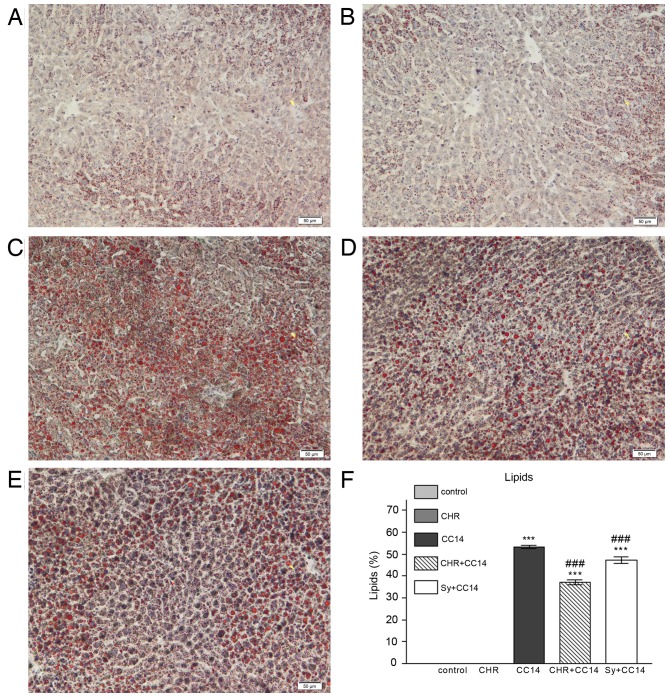
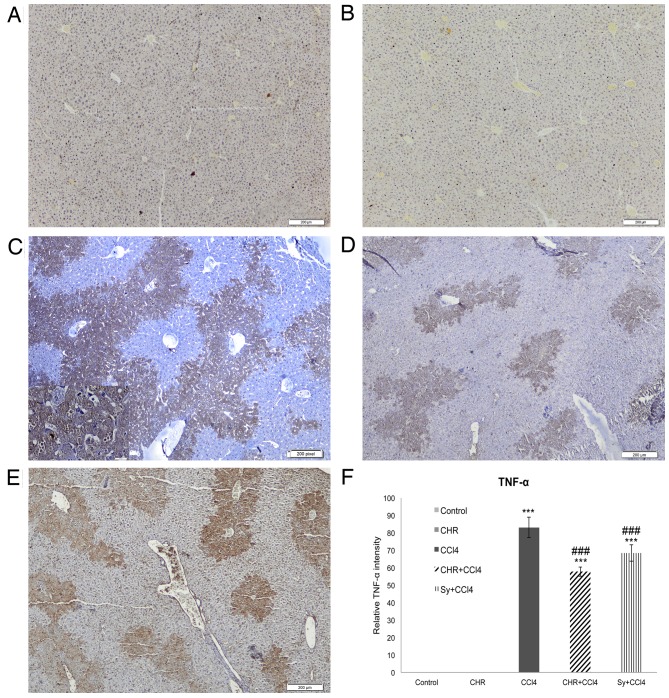
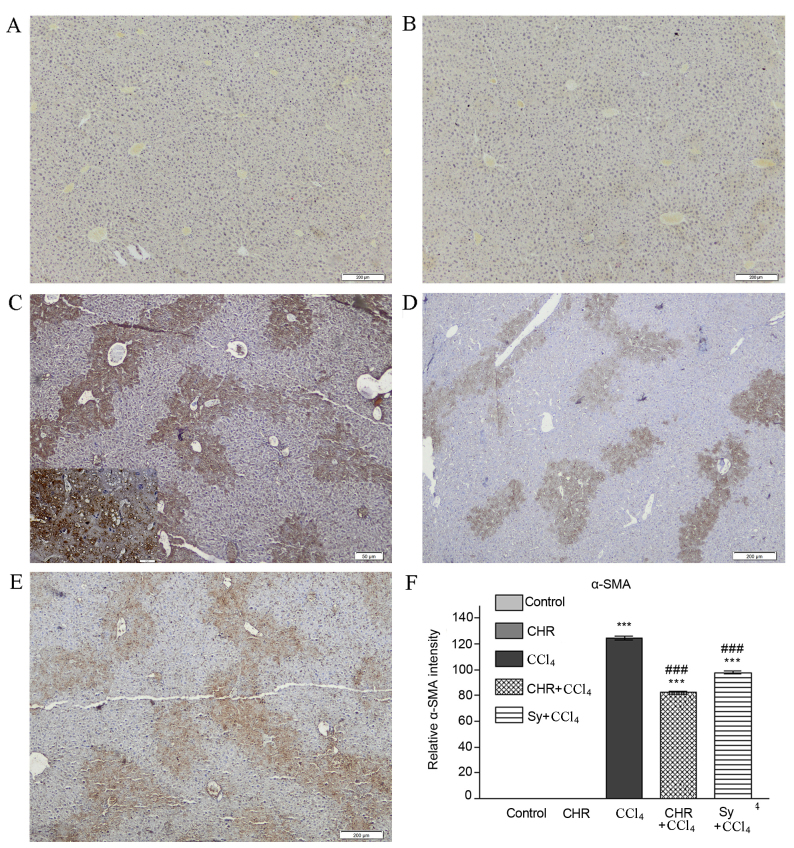
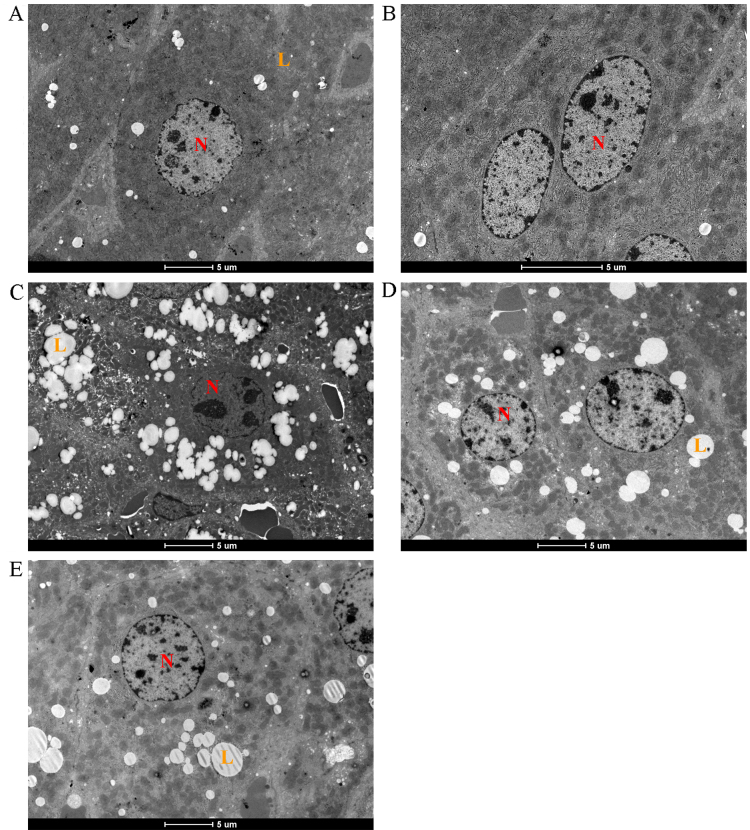
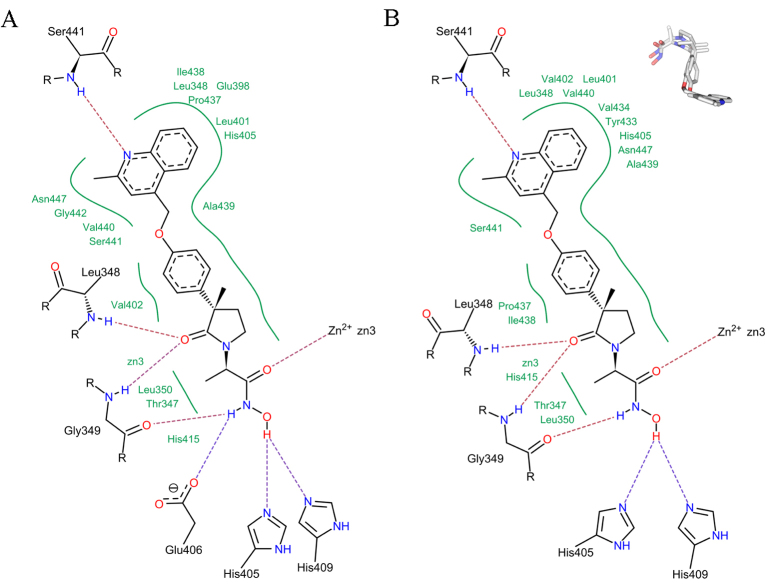
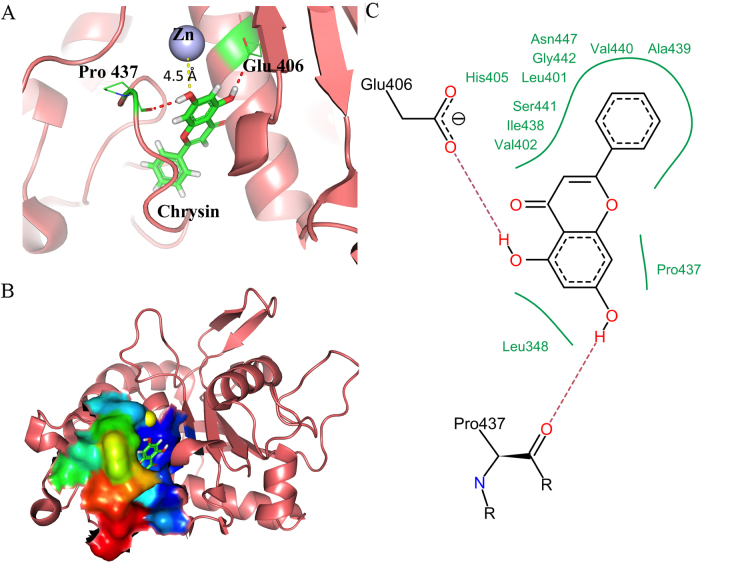
Chrysin (5,7-dihydroxyflavone) is a naturally occurring flavonoid present at high levels in honey, propolis and numerous plant extracts. Chrysin is known to have hepatoprotective activity, however, the mechanisms by which it exerts this effect remain unclear. In the present study, the effects of chrysin in carbon tetrachloride (CCl4)-induced acute liver damage were investigated and the results used to infer a possible mechanism behind chrysin's hepatoprotective activity. Prior to an intraperitoneal injection of CCl4 (1 ml/kg) to induce acute liver damage, chrysin (50 mg/kg) was administered orally to mice for 7 days. The positive control group was given 50 mg/kg standardized silymarin, a well-studied hepatoprotective flavonoid. Twenty-four h following CCl4 administration, an increase in the activity levels of serum aspartate-amino-transferase and alanine-amino-transferase was found. This was accompanied by extended centrilobular necrosis, steatosis and an altered hepatocyte ultrastructure. In addition, CCl4-induced acute hepatotoxicity was associated with an increase in hepatic tumor necrosis factor-α (TNF-α) and α-smooth muscle actin (α-SMA) protein expression, which was significantly decreased in the livers of mice pre-treated with chrysin (P<0.001), similar to the results of the silymarin pre-treated group (P<0.001). Treatment with chrysin prior to CCl4 exposure significantly reduced the activity of enzymes used as biochemical markers of poor liver function compared with the group which did not receive pre-treatment (P<0.001). In addition, the results of histopathological and electron microscopy liver examination showed chrysin pre-treatment reduced the effects of CCl4 treatment. Molecular modeling results demonstrated that the hepatoprotective activity of chrysin is mediated through TNF-α, as it reduces soluble TNF-α generation via blocking TNF-α-converting enzyme activity. In conclusion, the results of the present study suggest that inflammatory pathways are activated in CCl4-induced acute liver damage, which are ameliorated by chrysin pre-treatment. This indicates that chrysin is a potent hepatoprotective agent, similarly to silymarin at the same dose, which has the potential to be a viable alternative to conventional hepatoprotective treatments.
Keywords: carbon tetrachloride; chrysin; hepatoprotection; liver; molecular modeling; silymarin; tumor necrosis factor-α; α-smooth muscle actin.
Figures
Similar articles
-
Hepatoprotective effects of Micromeria croatica ethanolic extract against CCl4-induced liver injury in mice.BMC Complement Altern Med. 2015 Jul 15;15:233. doi: 10.1186/s12906-015-0763-8. BMC Complement Altern Med. 2015. PMID: 26174335 Free PMC article.
-
Assessment of hepatoprotective potential of N. indicum leaf on haloalkane xenobiotic induced hepatic injury in Swiss albino mice.Chem Biol Interact. 2015 Jun 25;235:37-46. doi: 10.1016/j.cbi.2015.03.025. Epub 2015 Apr 11. Chem Biol Interact. 2015. PMID: 25871905
-
Hepatoprotective activity of ethanolic extract of Salix subserrata against CCl4-induced chronic hepatotoxicity in rats.BMC Complement Altern Med. 2016 Jul 29;16:263. doi: 10.1186/s12906-016-1238-2. BMC Complement Altern Med. 2016. PMID: 27473536 Free PMC article.
-
A Review on the Role of Phytoconstituents Chrysin on the Protective Effect on Liver and Kidney.Curr Drug Discov Technol. 2024;21(1):e251023222716. doi: 10.2174/0115701638242317231018144944. Curr Drug Discov Technol. 2024. PMID: 37921185 Review.
-
Developing nutritional component chrysin as a therapeutic agent: Bioavailability and pharmacokinetics consideration, and ADME mechanisms.Biomed Pharmacother. 2021 Oct;142:112080. doi: 10.1016/j.biopha.2021.112080. Epub 2021 Aug 24. Biomed Pharmacother. 2021. PMID: 34449320 Free PMC article. Review.
Cited by
-
Structure Modification Converts the Hepatotoxic Tacrine into Novel Hepatoprotective Analogs.ACS Omega. 2024 Jan 2;9(2):2491-2503. doi: 10.1021/acsomega.3c07126. eCollection 2024 Jan 16. ACS Omega. 2024. PMID: 38250371 Free PMC article.
-
Ameliorative effects of allogeneic and xenogenic bone marrow-derived mesechymal stem cells on carbon tetrachloride-induced rat liver injury and cirrhosis via modulation of oxidative stress, apoptosis, inflammation, and Nrf2 expression.Am J Transl Res. 2023 Nov 15;15(11):6381-6403. eCollection 2023. Am J Transl Res. 2023. PMID: 38074814 Free PMC article.
-
Investigation of the protective effect of beta caryophyllene against indomethacin-induced gastric ulcer in rats: in vivo and in vitro study.Naunyn Schmiedebergs Arch Pharmacol. 2025 May 22. doi: 10.1007/s00210-025-04269-7. Online ahead of print. Naunyn Schmiedebergs Arch Pharmacol. 2025. PMID: 40402232
-
Ameliorative impacts of chrysin against gibberellic acid-induced liver and kidney damage through the regulation of antioxidants, oxidative stress, inflammatory cytokines, and apoptosis biomarkers.Toxicol Res (Camb). 2022 Feb 3;11(1):235-244. doi: 10.1093/toxres/tfac003. eCollection 2022 Feb. Toxicol Res (Camb). 2022. PMID: 35237428 Free PMC article.
-
Chronic consumption of the dietary polyphenol chrysin attenuates metabolic disease in fructose-fed rats.Eur J Nutr. 2020 Feb;59(1):151-165. doi: 10.1007/s00394-019-01895-9. Epub 2019 Jan 10. Eur J Nutr. 2020. PMID: 30631887
References
-
- Kaminski M, Wiaderkiewicz R. The role of the liver in xenobiotic biotransformation. Part I. The role of the liver and its cells and their interactions. Problems of Forensic Sciences. 2007;LXXII:357–378.
LinkOut - more resources
Full Text Sources
Other Literature Sources