. 2017 May;13(5):1875-1883.
doi: 10.3892/etm.2017.4189. Epub 2017 Mar 7.

Comparison of the purity and vitality of natural killer cells with different isolation kits

Affiliations

Comparison of the purity and vitality of natural killer cells with different isolation kits

Guangchuan Wang et al. Exp Ther Med. 2017 May.

Abstract

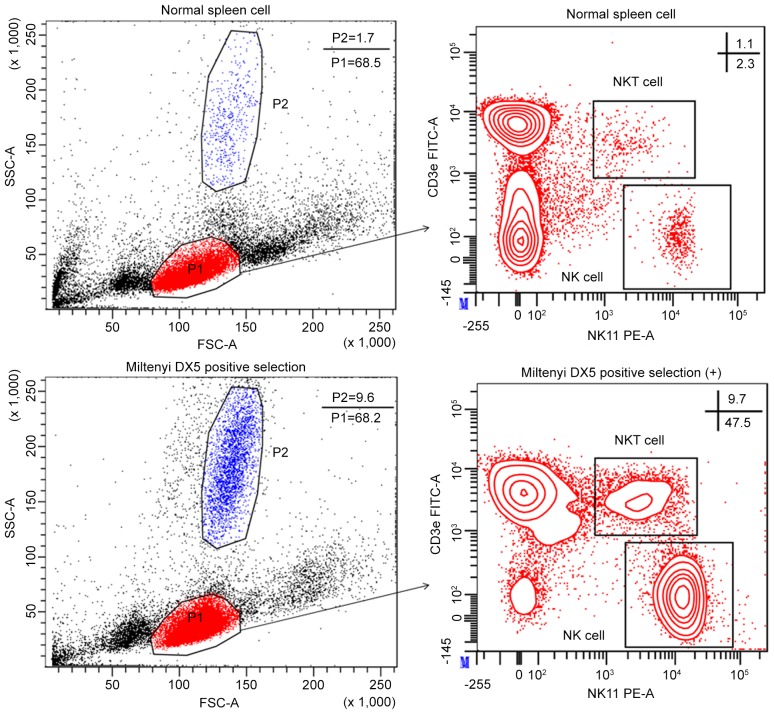
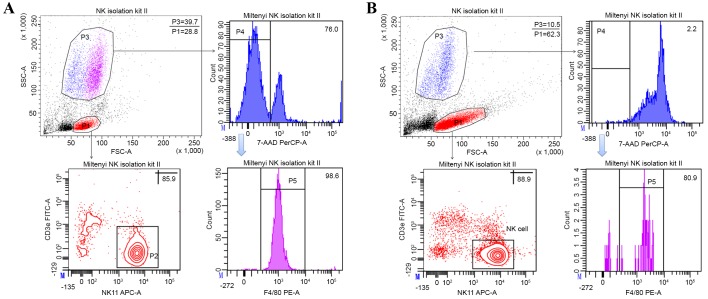
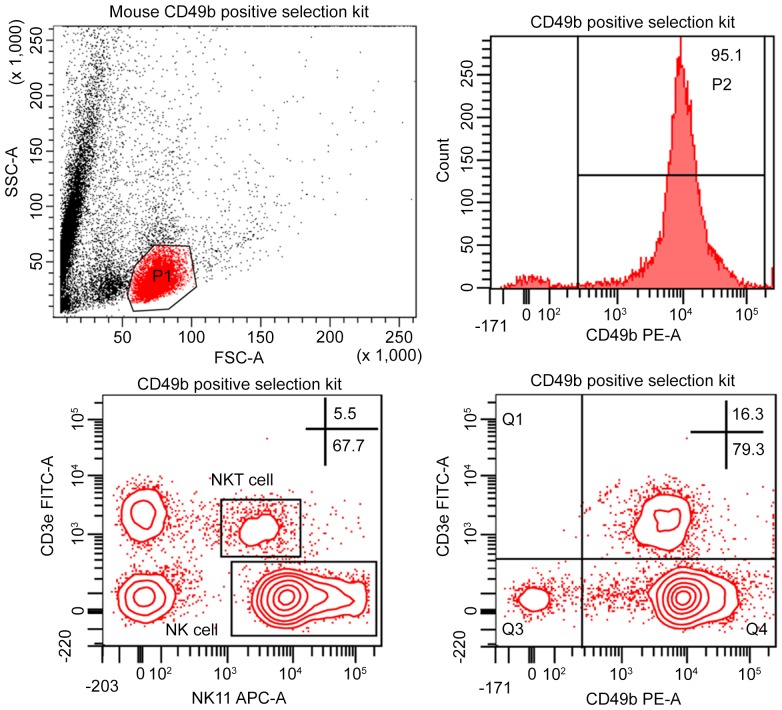
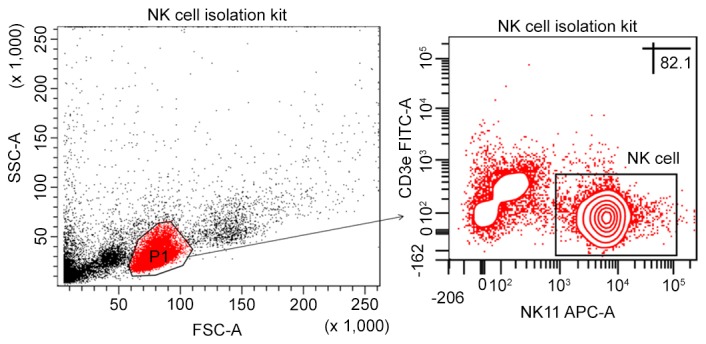
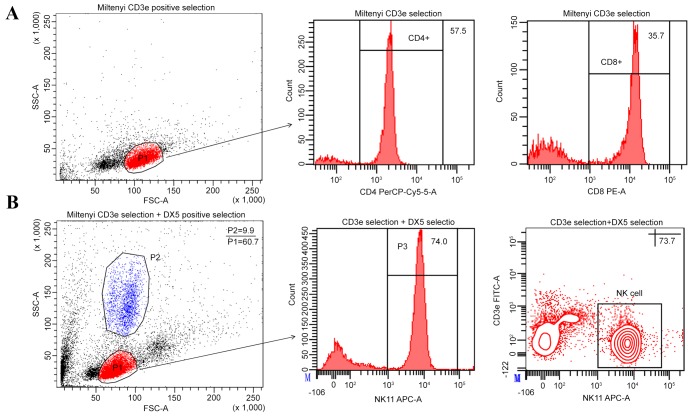
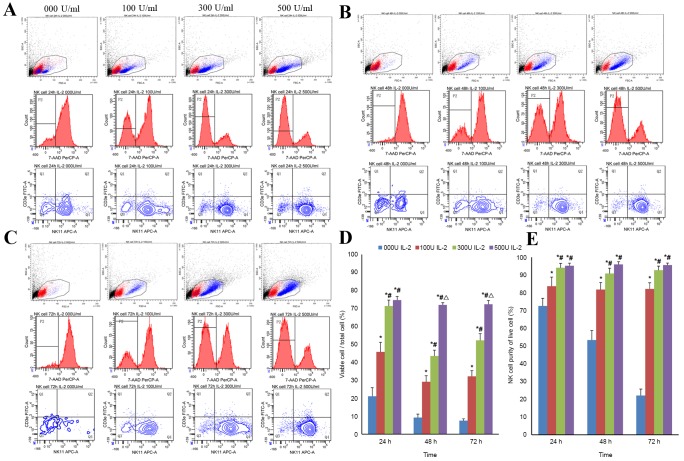
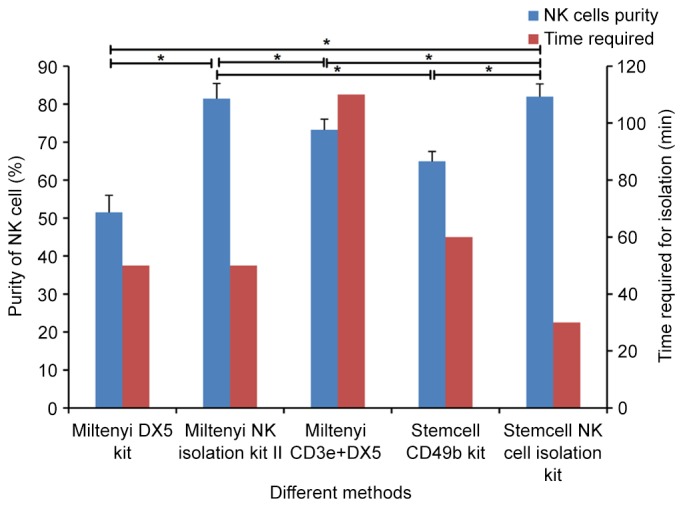
Natural killer (NK) cells are innate lymphocytes that aid in the protection of the host from infectious diseases and cancer. In vitro studies of NK cells have provided a foundation for developing clinical adoptive NK-cell transferred immunotherapy against human tumors. To elucidate the functions and mechanisms of NK cell populations, it is important to develop an optimal, highly reproducible and reliable isolation method. The present comparative study was performed with four different NK cell isolation kits of magnetic bead labeling made by Miltenyi and Stemcell companies, including positive selection kits [cluster of differentiation (CD)-49b, using the monoclonal antibody DX5) MicroBeads] and negative selection kits. In addition, the viability of NK cells isinterleukin-2 (IL-2)-dependent in vitro and thus the concentration of IL-2 is critical for maintaining longer cell viability of NK cells. NK cell purity and viability after culturing, for 24, 48 or 72 h, with or without IL-2 (0, 100, 300 or 500 U/ml) was investigated in the present study. Purity of NK cells varied depending on the purification kit used, despite the same method being applied. Furthermore, more granulocytes were present in purified NK cells using Miltenyi sorting kits, particularly when using the negative selection kit. The main disadvantage of DX5-positive selection using the Stemcell and Miltenyi kits was that a high percentage of CD3ε+ cells were mixed into the isolated NK cells. Additionally, a significant difference of NK cell purity (P=0.003) was observed while purification was performed using different surface markers. As a consequence, the use of the positive selection kit was modified and subsequently a significantly higher purity (P=0.002) and yield (P=0.004) of NK cells was obtained. Moreover, the purity of NK cells and viability with or without a range of concentrations of IL-2 was compared. Results indicated that with a higher IL-2 concentration, the NK cell purity and viability were significantly higher (P<0.05). To our knowledge, this is the first report that has compared the disadvantages of four commercial NK cell isolation kits from two well-known companies, and identified the effect of NK cell purity and viability, using different concentrations of IL-2. To conclude, the results of the present study are fundamental in aiding the further development of NK cell therapy protocols for murine in vivo models.

Keywords: DX5; interleukin-2; magnetic-activated cell sorting; natural killer cell culture; natural killer cell isolation; natural killer cells.


Figures

Figure 1.
Figure 1.
FCM analysis of purified splenic NK cells using a Miltenyi CD49b (DX5) positive selection kit. Purity of NK cell isolates was evaluated using FCM. The indicated percentage of contaminated granulocytes was represented as the granulocytes population (P2)/total cell population ×100. NK cell purity is shown as a percentage of the total gated viable lymphocyte population. NK cells were defined as NK1.1+CD3ε. The indicated percentages represent the purity efficacy represented as the NK cell population/total viable lymphocyte population (P1) ×100. The percentage of NKT cell defined as NK1.1+CD3ε+ was also indicated. This plot is one representative experiment obtained from at least three separate assays performed in parallel. FCM, flow cytometry; NK, natural killer; FSC, forward scatter; SSC, side scatter; FITC, fluorescein isothiocyanate; PE, phycoerythrin; NKT cell, natural killer T cell.
Figure 2.
Figure 2.
FCM analysis of purified splenic NK cells using a Miltenyi NK cell isolation kit II. (A) Purity of NK cell isolates were evaluated using FCM. NK cell purity is shown as a percentage of the total gated viable lymphocyte population (P1). NK cells were defined as NK1.1+CD3ε. The indicated percentages represent the purity efficacy represented as the NK cell population/total viable lymphocyte population (P1) ×100. A large population at the position of granulocytes (P3) was identified using F4/80 antibody. (B) Purity of NK cells and the contaminated granulocytes were evaluated using FCM following culturing with 500 U/ml of IL-2 for 24 h. This plot is one representative experiment obtained from at least three separate assays performed in parallel. FCM, flow cytometry; NK, natural killer; CD, cluster of differentiation; FSC, forward scatter; SSC, side scatter; FITC, fluorescein isothiocyanate; PE, phycoerythrin.
Figure 3.
Figure 3.
FCM analysis of purified splenic NK cells using a Stemcell CD49b positive selection kit. NK cell purity is shown as a percentage of the total gated viable lymphocyte population (P1). The histogram represents the percentage of CD49b+ cells of P1. NK cells were defined as NK1.1+CD3ε or CD49b+CD3ε. The indicated percentages represent the purity efficacy represented as the NK cell population/total viable lymphocyte population (P1) ×100. The percentage of NKT cell, defined as NK1.1+CD3ε+, was also indicated. This plot is one representative experiment obtained from at least three separate assays performed in parallel. FCM, flow cytometry; NK, natural killer; CD, cluster of differentiation; FSC, forward scatter; SSC, side scatter; FITC, fluorescein isothiocyanate; PE, phycoerythrin; NKT cell, natural killer T cell.
Figure 4.
Figure 4.
FCM analysis of purified splenic NK cells using a Stemcell mouse NK cell isolation kit. NK cell purity is shown as a percentage of the total gated viable lymphocyte population (P1). The indicated percentage represents the purity efficacy represented as the NK cell population/total viable lymphocyte population (P1) ×100. This plot is one representative experiment obtained from at least three separate assays performed in parallel. FCM, flow cytometry; NK, natural killer; FSC, forward scatter; SSC, side scatter; FITC, fluorescein isothiocyanate; PE, phycoerythrin.
Figure 5.
Figure 5.
FCM analysis of purified splenic NK cells using a modified NK cell isolation protocol. (A) Results from using the Miltenyi CD3ε MicroBead kit. CD4+ and CD8+ cell purity is shown as a percentage of the total gated viable lymphocyte population (P1). The indicated histogram percentages represent the purity efficacy represented as the CD4+ or CD8+ cell population/total viable lymphocyte population (P1) ×100. (B) Results of using the Miltenyi CD3ε MicroBead kit in combination with the Miltenyi CD49b (DX5) positive selection kit. The indicated percentage of contaminated granulocytes represented as the granulocytes population (P2)/total cell population ×100. NK cell purity is shown as a percentage of the total gated viable lymphocyte population (P1). The indicated histogram percentages represent the NK1.1+ cell population/total viable lymphocyte population (P1) ×100. FCM, flow cytometry; NK, natural killer; CD, cluster of differentiation; FSC, forward scatter; SSC, side scatter; FITC, fluorescein isothiocyanate; PE, phycoerythrin.
Figure 6.
Figure 6.
Analysis of the purity and viability of NK cells in the presence of different concentrations of IL-2 by FCM. Purity and viability of NK cell were evaluated using FCM following culturing for (A) 24, (B) 48 or (C) 72 h. All cells, except debris, were gated based on FSC and SSC. Subsequently, 7-AAD was used to identify the percentage of viable cells. NK cell purity was assessed in viable cells using NK1.1+CD3ε. (D) Viability and (E) purity of NK cells following culturing for 24, 48, and 72 h. Data are expressed as mean ± standard deviation. *P<0.05 vs. the group treated with 0 U/ml of IL-2; #P<0.05 vs. the group treated with 100 U/ml of IL-2; ΔP<0.05 vs. the group treated with 300 U/ml of IL-2. FCM, flow cytometry; NK, natural killer; 7-AAD, 7-aminoactinomycin D; IL-2, interleukin-2; FSC, forward scatter; SSC, side scatter; FITC, fluorescein isothiocyanate; PE, phycoerythrin.
Figure 7.
Figure 7.
NK cell purity and the time required for isolation in different kits. The left Y-axis represents the NK cell purity obtained using the different methods. Data are expressed as mean ± standard deviation. The right Y-axis represents the time required for purification, according to manufacturer's instructions of each respective kit. *P<0.05. NK, natural killer; CD, cluster of differentiation.

Similar articles

Cited by

References

    1. Jost S, Altfeld M. Control of human viral infections by natural killer cells. Annu Rev Immunol. 2013;31:163–194. doi: 10.1146/annurev-immunol-032712-100001. - DOI - PubMed
    1. Bär E, Whitney PG, Moor K, Sousa Reise C, LeibundGut-Landmann S. IL-17 regulates systemic fungal immunity by controlling the functional competence of NK cells. Immunity. 2014;40:117–127. doi: 10.1016/j.immuni.2013.12.002. - DOI - PubMed
    1. Zitvogel L, Galluzzi L, Smyth MJ, Kroemer G. Mechanism of action of conventional and targeted anticancer therapies: Reinstating immunosurveillance. Immunity. 2013;39:74–88. doi: 10.1016/j.immuni.2013.06.014. - DOI - PubMed
    1. Tian Z, Gershwin ME, Zhang C. Regulatory NK cells in autoimmune disease. J Autoimmun. 2012;39:206–215. doi: 10.1016/j.jaut.2012.05.006. - DOI - PubMed
    1. Kim HS, Das A, Gross CC, Bryceson YT, Long EO. Synergistic signals for natural cytotoxicity are required to overcome inhibition by c-Cbl ubiquitin ligase. Immunity. 2010;32:175–186. doi: 10.1016/j.immuni.2010.02.004. - DOI - PMC - PubMed