. 2017 Jul 3;214(7):2121-2138.
doi: 10.1084/jem.20161070. Epub 2017 May 31.

Enzymatic lipid oxidation by eosinophils propagates coagulation, hemostasis, and thrombotic disease

Affiliations

Enzymatic lipid oxidation by eosinophils propagates coagulation, hemostasis, and thrombotic disease

Stefan Uderhardt et al. J Exp Med. .

Erratum in

  • Correction: Enzymatic lipid oxidation by eosinophils propagates coagulation, hemostasis, and thrombotic disease.
    Uderhardt S, Ackermann JA, Fillep T, Hammond VJ, Willeit J, Santer P, Mayr M, Biburger M, Miller M, Zellner KR, Stark K, Zarbock A, Rossaint J, Schubert I, Mielenz D, Dietel B, Raaz-Schrauder D, Ay C, Gremmel T, Thaler J, Heim C, Herrmann M, Collins PW, Schabbauer G, Mackman N, Voehringer D, Nadler JL, Lee JJ, Massberg S, Rauh M, Kiechl S, Schett G, O'Donnell VB, Krönke G. Uderhardt S, et al. J Exp Med. 2018 Mar 5;215(3):1003. doi: 10.1084/jem.2016107002142018c. Epub 2018 Feb 20. J Exp Med. 2018. PMID: 29463570 Free PMC article. No abstract available.

Abstract

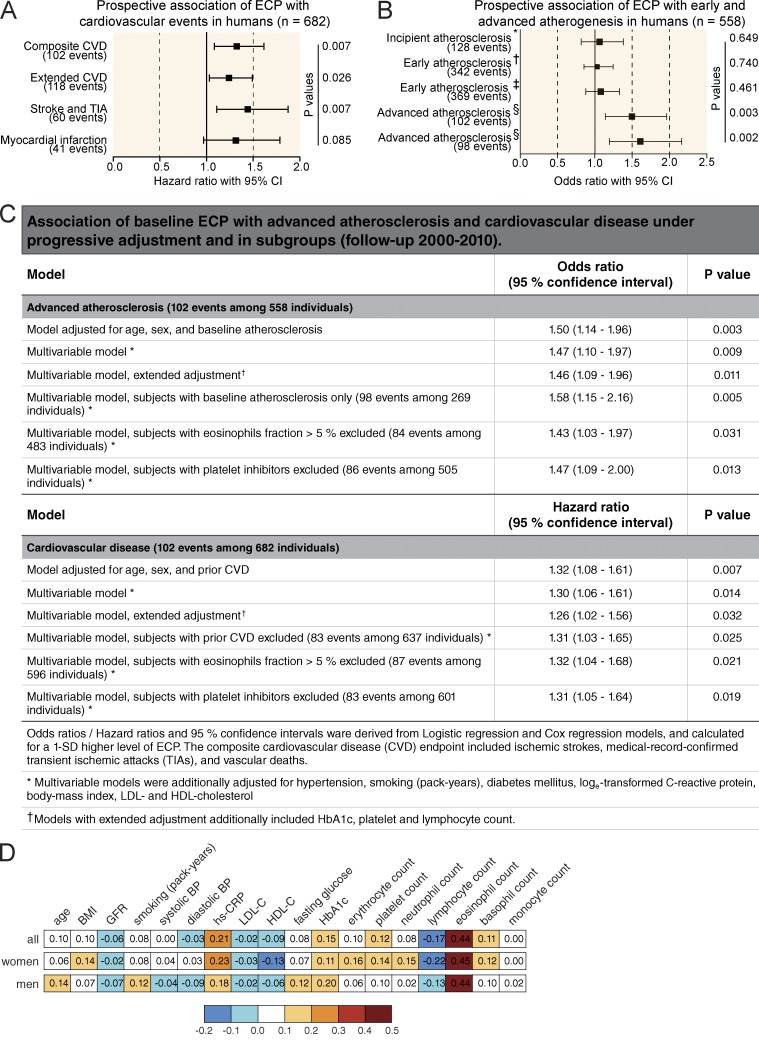
Blood coagulation is essential for physiological hemostasis but simultaneously contributes to thrombotic disease. However, molecular and cellular events controlling initiation and propagation of coagulation are still incompletely understood. In this study, we demonstrate an unexpected role of eosinophils during plasmatic coagulation, hemostasis, and thrombosis. Using a large-scale epidemiological approach, we identified eosinophil cationic protein as an independent and predictive risk factor for thrombotic events in humans. Concurrent experiments showed that eosinophils contributed to intravascular thrombosis by exhibiting a strong endogenous thrombin-generation capacity that relied on the enzymatic generation and active provision of a procoagulant phospholipid surface enriched in 12/15-lipoxygenase-derived hydroxyeicosatetraenoic acid-phosphatidylethanolamines. Our findings reveal a previously unrecognized role of eosinophils and enzymatic lipid oxidation as regulatory elements that facilitate both hemostasis and thrombosis in response to vascular injury, thus identifying promising new targets for the treatment of thrombotic disease.


Figures

Figure 1.
Figure 1.
Elevation of ECP serves as a marker for CVD in humans. (A and B) Forest plots of the prospective association of baseline ECP with events of CVD (A) and early and advanced atherosclerosis (B) in the Bruneck Study (follow-up 2000 to 2010). All analyses were adjusted for age, sex, and prior CVD. Analyses focusing on ultrasound endpoints were adjusted to the extent of baseline atherosclerosis (log-transformed atherosclerosis summation score). Squares and lines represent hazard ratios of events and 95% confidence intervals (CI). Hazard ratios were derived from Cox regression models and calculated for a 1-SD–higher level of ECP. Composite CVD events considered ischemic strokes, medical record–confirmed TIAs, myocardial infarctions, and vascular deaths. Mean and median follow-ups were 8.6 and 10 yr. The extended CVD events additionally considered revascularization procedures. *, This analysis is confined to 277 individuals free of atherosclerosis at baseline and focused on the manifestation of first carotid plaques. , This analysis considers all 558 individuals with ultrasound follow-up and focused on the manifestation of new carotid plaques. , This analysis considers all 558 individuals with ultrasound follow-up and focused on both the manifestation of new carotid plaques and extension of existing ones. §, This analysis considers all 558 individuals with ultrasound follow-up and focused on the development of advanced complicated plaques (stenosis >40%). The second line is confined to 269 subjects with manifest baseline atherosclerosis. (C) Odds ratios/hazard ratios and 95% confidence intervals derived from logistic regression and Cox regression models and calculated for a 1-SD–higher level of ECP. The composite CVD endpoint included ischemic strokes, medical record–confirmed TIAs, myocardial infarctions, and vascular deaths. *, Multivariable models were additionally adjusted for hypertension, smoking (pack-years), diabetes, log-transformed C-reactive protein, body-mass index, and LDL and HDL cholesterol. , Models with extended adjustment additionally included HbA1c, platelet, and lymphocyte counts. (D) Correlation pattern of ECP level with blood cell counts and demographic and vascular risk factors in the Bruneck Study (evaluation 2000; n = 682 including 354 women and 328 men). BP, blood pressure; GFR, glomerular filtration rate; HbA1c, glycated hemoglobin; HDL-C, HDL cholesterol; hs-CRP, high-sensitivity C-reactive protein; LDL-C, LDL cholesterol. Spearman correlation coefficients are given for all variables. Correlations that are statistically significant after correction for multiple comparisons (Bonferroni-corrected p-value <0.05) are in bold, and corresponding squares have covering colors.
Figure 2.
Figure 2.
Eosinophils contribute to intravascular thrombosis and hemostasis. (A) Representative microscopy image (n = 5) showing immunofluorescence staining for platelets (CD41; green), eosinophils (CCR3; red), and cellular nuclei (DAPI; blue) in a ferric chloride (FeCl)–induced thrombus of a mouse IVC. White arrowheads indicate CCR3+ eosinophils, and dashed lines mark lacunae surrounded by platelet aggregates. Bar, 100 µm. (B) Relative number of eosinophils in IVC thrombi of WT mice compared with peripheral blood counts. n = 5. (C and D) FeCl-induced IVC thrombus of ΔdblGATA1 mice (BALB/c background; n = 4; C), PHIL mice (C57BL/6 background; n = 10; D), and their corresponding WT littermates. Bar, 2 mm. (E) FeCl-induced IVC thrombosis in WT mice treated with anti-SiglecF antibody (n = 4) or isotope control. (F) Measurement of TAT complexes in plasma from dblGATA1 mice (n = 5) after FeCl-induced IVC thrombosis. (G) Representative image of a FeCl-induced thrombosis of the carotid artery in WT or ΔdblGATA1 mice (30 min after FeCl-induced injury) and quantification of the kinetics of thrombus formation and dissolution (right; see also supplementary videos). n = 4. Bars, 200 µm. (H) Bleeding assays (15-mm tail cut) with WT (BALB/c; n = 5) and ΔdblGATA1 mice (n = 9). Bar graphs show relative weight loss, OD575nm of the lost blood after lysis, and primary bleeding time (time until the first stop of bleeding). Data are representative of at least three independent experiments. Error bars represent SEM. *, P < 0.05; **, P < 0.01; ***, P < 0.001; ****, P < 0.0001; Student’s t test.
Figure 3.
Figure 3.
Eosinophils autonomously initiate thrombin generation. (A and B) Calibrated thrombin generation curve of in vitro–generated mouse eosinophils (mEOS; A) or human eosinophils (huEOS; B) after stimulation with ADP and/or collagen. Bar graphs show endogenous thrombin potential (ETP; nM*min) and peak of thrombin generation (peak; nM). (C) Calibrated FXa generation curve of mouse eosinophils. AU, arbitrary units. (D) Plasma clotting time experiments with in vitro–generated mouse eosinophils (Eos) stimulated with ADP or collagen. Bar graphs display calculated clotting index. The black bar shows plasma with ADP alone. (E, left) Quantitative RT-PCR analysis of TF mRNA (F3) expression in mouse monocytes (monos), neutrophils (PMN), eosinophils (eos), and platelets (plts); expression of the gene of interest was normalized to Atcb expression. (Right) Western blot analysis of TF protein (47 kD) expression in sorted mouse leukocytes. (F) Flow cytometry analysis of the exposure of TF on the surface of resting or ADP-stimulated mouse eosinophils. Histograms show representative flow cytometric stainings, and bar graphs show mean geometric fluorescence intensities (geom. MFI). (G, left) Calibrated thrombin generation assay with ADP-stimulated mouse eosinophils in the presence of blocking anti-TF antibody or isotope control. (Right) Bar graphs show endogenous thrombin potential (ETP; nM*min) and peak of thrombin generation (peak; nM). Data are representative of at least three independent experiments. Error bars represent SEM. *, P < 0.05; **, P < 0.01; ***, P < 0.001; ****, P < 0.0001; Student’s t test.
Figure 4.
Figure 4.
Ca2+-dependent exposure of aminophospholipids by eosinophils promote thrombin generation. (A) Flow cytometry analysis of the binding of annexin V (AxV) to aminophospholipids on the surface of resting or ADP-stimulated mouse eosinophils. Histograms show representative annexin V stainings, and bar graphs show mean geometric fluorescence intensities (gMFI). (B) LC/MS/MS-based quantification of the exposure of the aminophospholipids PE and PS in mouse eosinophils in response to ADP stimulation. (C, left) Calibrated thrombin generation assays with resting or ADP-stimulated mouse eosinophils in the presence of annexin V. (Right) Bar graphs show endogenous thrombin potential (ETP; nM*min) and peak of thrombin generation (peak; nM). (D) Flow cytometry analysis of annexin V binding on mouse eosinophils over time in the presence of calcium ionophore A23187, ADP, or vehicle. (E) Flow cytometry analysis of annexin V binding on mouse eosinophils in the presence of tannic acid (TA) or intracellular Ca2+-chelator BAPTA/AM. Bar graphs show geometric mean fluorescence intensity. (F) Flow cytometry–based analysis of intracellular Ca2+ signaling, indicated by Fluo3/FuraRed ratio, over time in a Ca2+-free environment. Where indicated (arrow and Ca2+), CaCl2 at a final concentration of 1 mM was added. (G) Flow cytometry–based analysis of intracellular Ca2+ signaling, indicated by Fluo3/FuraRed ratio, over time in a Ca2+-free environment. (H) Postulated mechanism of a sequential generation and Ca2+-dependent externalization of aminophospholipids (APL) at the surface of eosinophils. OH indicates hydroxyl group. Data are representative of at least three independent experiments. Error bars represent SEM. *, P < 0.05; ***, P < 0.001.
Figure 5.
Figure 5.
12/15-LO–mediated oxidation of membrane phospholipids initiates eosinophil-mediated thrombin formation. (A) Representative LC/MS/MS analysis of different 12-HETE-PE oxidation species in lipid extracts of in vitro–generated mouse eosinophils. Cps, counts per second. (B) Quantitative RT-PCR analysis of 12/15-LO mRNA (Alox15) and 12-LO mRNA (Alox12) in mouse monocytes (monos; CD11b+CD115+), neutrophils (PMN; CD11b+Ly6G+), eosinophils (eos; side scatterhiCD11b+Siglec-F+), and platelets (plts) after FACS. Expression was normalized to Atcb expression. rel., relative. (C) Western blot of 12/15-LO protein (74 kD) expression in WT and Alox15−/− mouse eosinophils. (D) Quantitative RT-PCR analysis of Alox5 and Alox15 mRNA (top) and Western blot analysis of 15-LO protein (bottom) expression in human neutrophils (huPMN) and human eosinophils (huEos) isolated by Ficoll density gradient centrifugation and magnetic cell separation. mRNA expression was normalized to Actb. (E) Flow cytometry analysis of 12/15-LO in eosinophils (side scatterhiSiglecF+) isolated from peripheral blood of WT and Alox15−/− mice. (F) Flow cytometry analysis of the side scatter (SSC)hi12/15-LO+ population in blood from WT, Alox15−/−, and ΔdblGATA1 mice. (G) LC/MS/MS-based quantification of different esterified 12- and 15-HETE-PE, nonesterified 5-, 8-, 11-, 12-, and 15-HETE species, and prostaglandins D2 and E2 (PGD2 and PGE2) in WT (blue) and Alox15−/− (red) mouse eosinophils. Levels are presented as nanograms per 106 cells. (H, left) Calibrated thrombin generation curve of mouse WT eosinophils, eosinophils treated with baicalein (Bai), and Alox15−/− eosinophils. (Right) Bar graphs show endogenous thrombin potential (ETP; nM*min) and peak of thrombin generation (peak; nM). (I) Plasmatic clotting time experiments with WT mouse eosinophils (EOS), mouse eosinophils treated with the 12/15-LO inhibitor baicalein, and Alox15−/− mouse eosinophils. Bar graphs display calculated clotting index. The black bar shows plasma with ADP alone. (J, left) Calibrated thrombin generation assay with lysates generated from human eosinophils in the presence of PRP reagent (see Materials and methods). (Right) Bar graphs show endogenous thrombin potential (nM*min) and peak of thrombin generation (nM). (K, left) Calibrated thrombin generation assays with WT and Alox15−/− mouse eosinophils in the presence of phosphatidylcholine/PS liposomes carrying oxidized 12-HETE-PE or nonoxidized PE (SAPE) species, as indicated. (Right) Bar graphs show endogenous thrombin potential (nM*min) and peak of thrombin generation (nM). Data are representative of at least three independent experiments. Error bars represent SEM. *, P < 0.05; **, P < 0.01; ***, P < 0.001; ****, P < 0.0001; Student’s t test.
Figure 6.
Figure 6.
12/15-LO–induced coagulation contributes to thrombus formation and hemostasis. (A and B) TAT complex formation (n = 6; A) and thrombus formation (n = 4; B) after ferric chloride (FeCl)–induced thrombosis of the IVC in Alox15−/− mice (C57BL/6 background) and WT littermates. (C) Bleeding assays (15-mm tail cut) with WT (C57BL/6) mice, Alox15−/− mice, and WT mice treated with baicalein (n = 6 each). Bar graphs show relative weight loss, OD575nm of the lost blood after lysis, and primary bleeding time (time until first stop of bleeding). (D and E) FeCl-induced IVC thrombus formation in mice carrying an eosinophil-specific deletion of Alox15 (Alox15fl/fl; n = 10) and their WT littermates (Alox15+/+; n = 9; D) and mice that received the 12/15-LO inhibitor baicalein (n = 4) and a vehicle (n = 4; E). Data are representative of at least three independent experiments. Error bars represent SEM. *, P < 0.05; **, P < 0.01; ***, P < 0.001; Student’s t test. (F) Proposed mechanism of the eosinophil-mediated and 12/15-LO–induced thrombin generation in response to platelet aggregation.

Similar articles

Cited by

References

    1. Ames P.R., Margaglione M., Mackie S., and Alves J.D.. 2010. Eosinophilia and thrombophilia in churg strauss syndrome: a clinical and pathogenetic overview. Clin. Appl. Thromb. Hemost. 16:628–636. 10.1177/1076029609348647 - DOI - PubMed
    1. Assarsson E., Lundberg M., Holmquist G., Björkesten J., Thorsen S.B., Ekman D., Eriksson A., Rennel Dickens E., Ohlsson S., Edfeldt G., et al. . 2014. Homogenous 96-plex PEA immunoassay exhibiting high sensitivity, specificity, and excellent scalability. PLoS One. 9:e95192 10.1371/journal.pone.0095192 - DOI - PMC - PubMed
    1. Bergmeier W., Weidinger C., Zee I., and Feske S.. 2013. Emerging roles of store-operated Ca2+ entry through STIM and ORAI proteins in immunity, hemostasis and cancer. Channels (Austin). 7:379–391. 10.4161/chan.24302 - DOI - PMC - PubMed
    1. Bouchard B.A., Mann K.G., and Butenas S.. 2010. No evidence for tissue factor on platelets. Blood. 116:854–855. 10.1182/blood-2010-05-285627 - DOI - PMC - PubMed
    1. Clark S.R., Thomas C.P., Hammond V.J., Aldrovandi M., Wilkinson G.W., Hart K.W., Murphy R.C., Collins P.W., and O’Donnell V.B.. 2013. Characterization of platelet aminophospholipid externalization reveals fatty acids as molecular determinants that regulate coagulation. Proc. Natl. Acad. Sci. USA. 110:5875–5880. 10.1073/pnas.1222419110 - DOI - PMC - PubMed

MeSH terms