. 2017 Aug 1;118(2):1376-1393.
doi: 10.1152/jn.00094.2017. Epub 2017 May 31.

Diverse effects of stimulus history in waking mouse auditory cortex

Affiliations

Diverse effects of stimulus history in waking mouse auditory cortex

Elizabeth A K Phillips et al. J Neurophysiol. .

Abstract

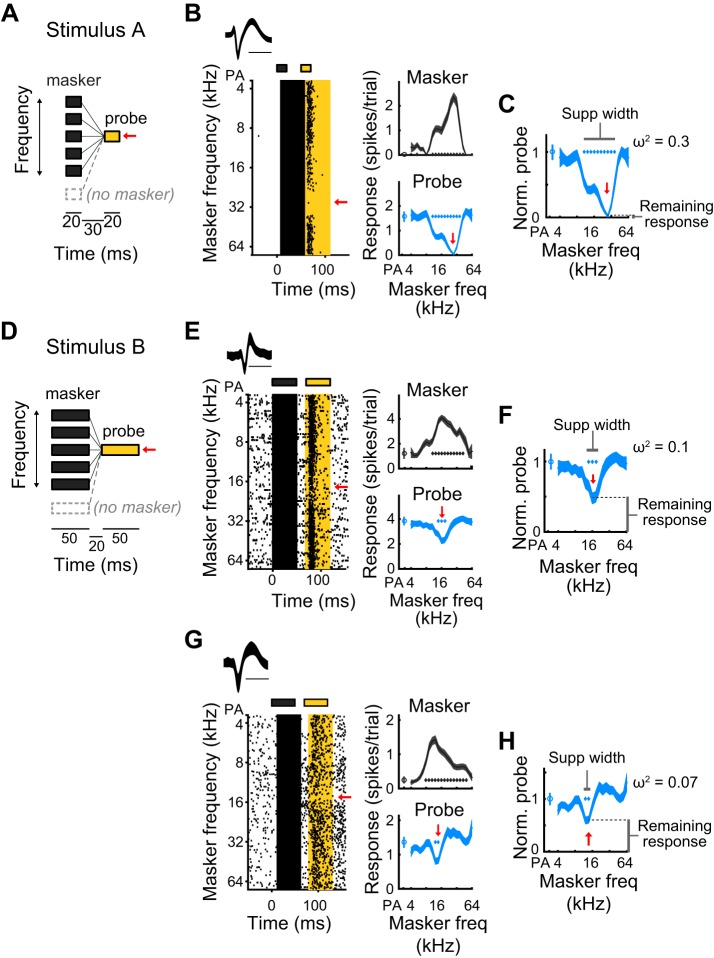
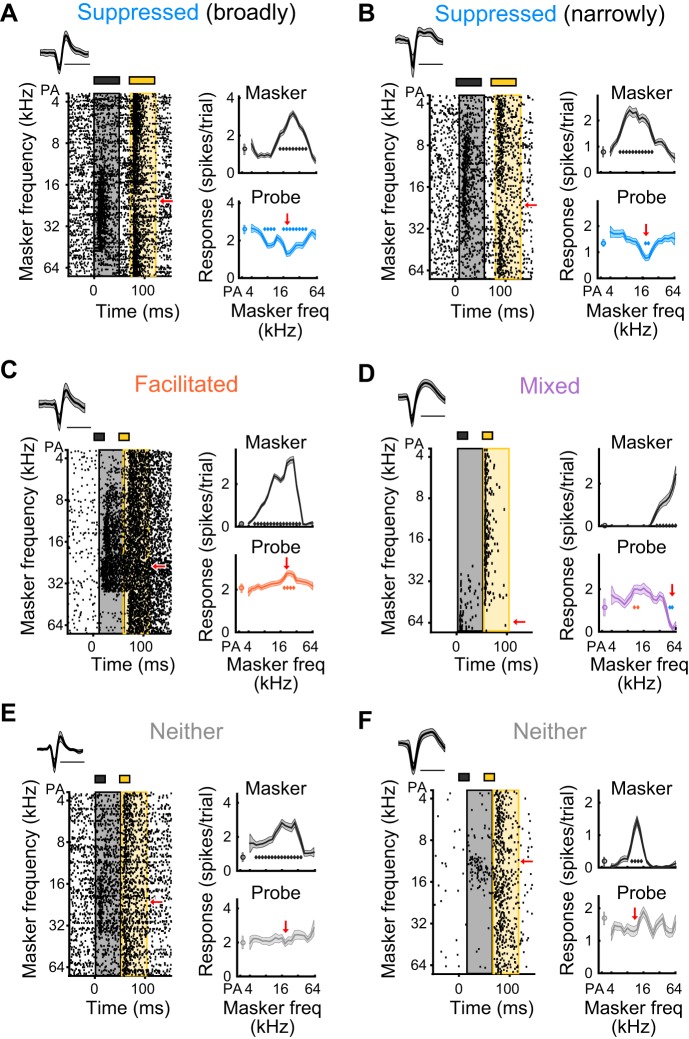
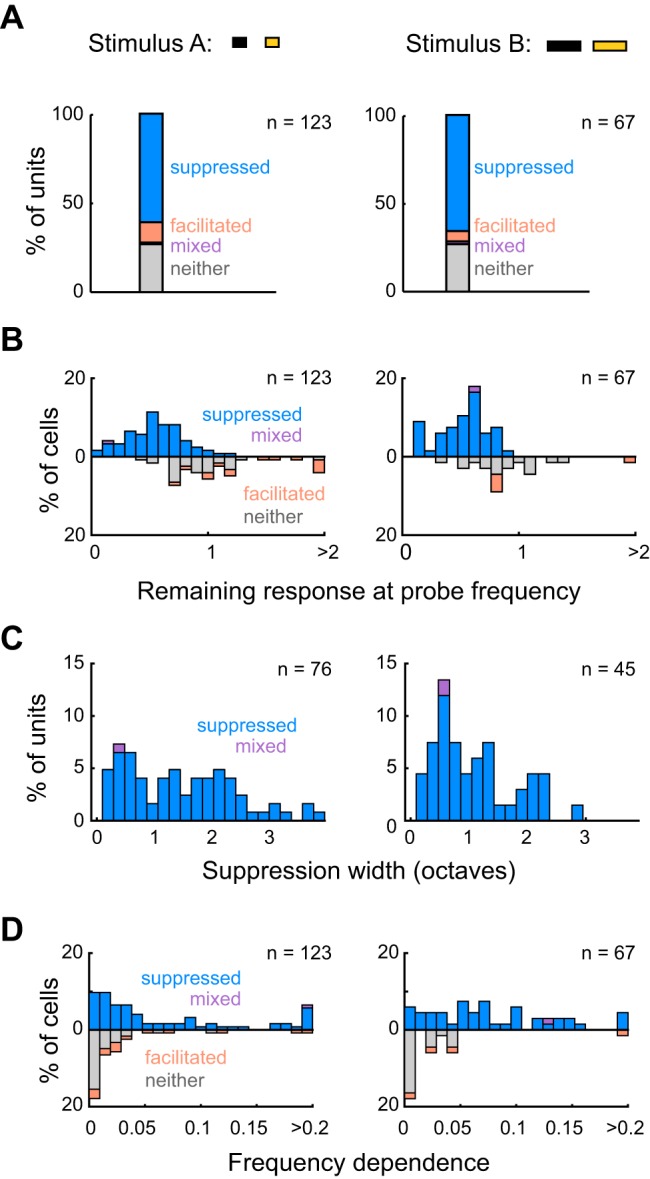
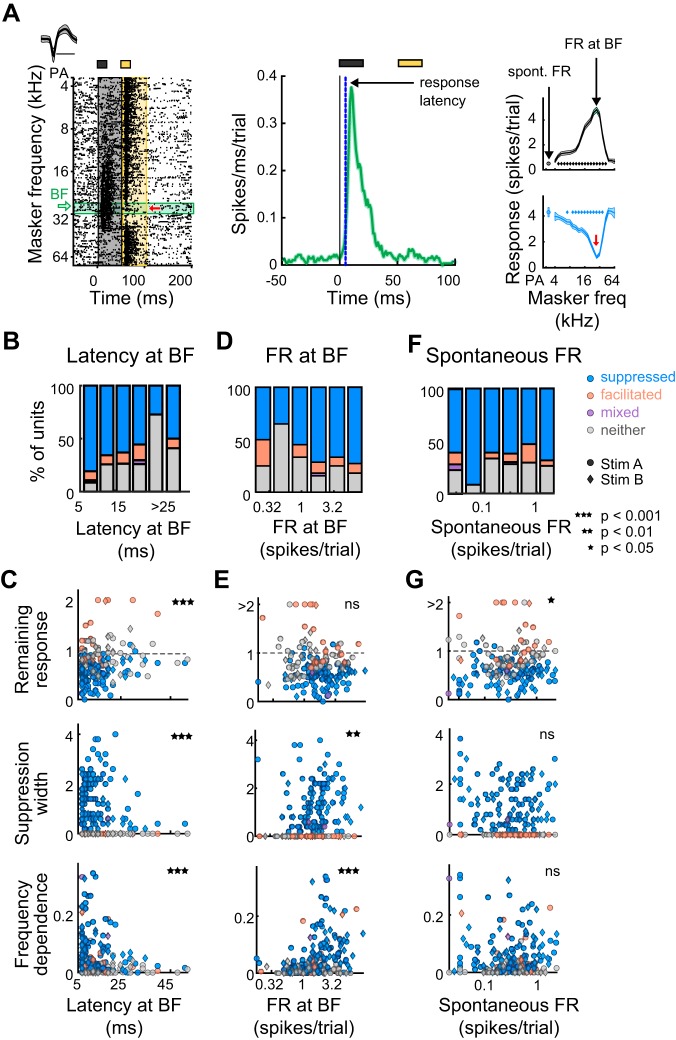
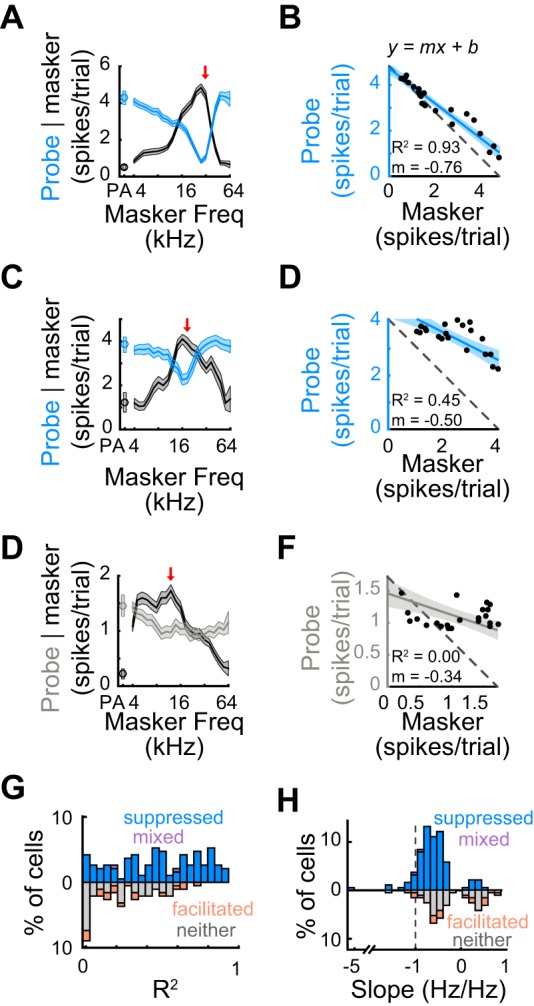
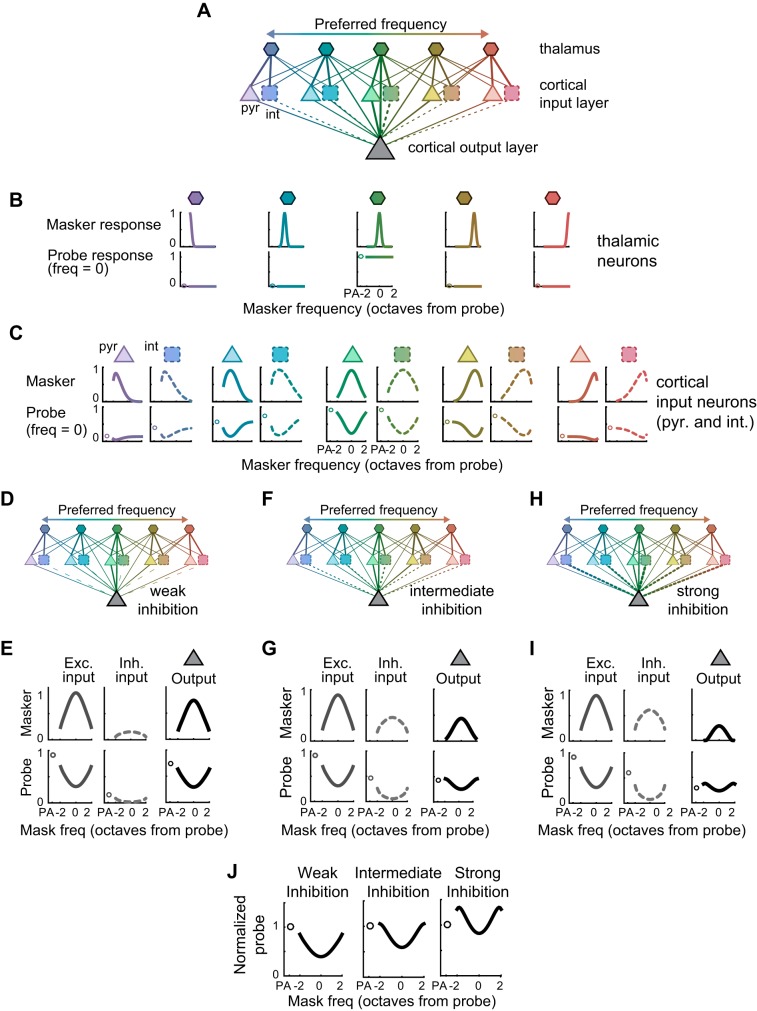
Responses to auditory stimuli are often strongly influenced by recent stimulus history. For example, in a paradigm called forward suppression, brief sounds can suppress the perception of, and the neural responses to, a subsequent sound, with the magnitude of this suppression depending on both the spectral and temporal distances between the sounds. As a step towards understanding the mechanisms that generate these adaptive representations in awake animals, we quantitatively characterize responses to two-tone sequences in the auditory cortex of waking mice. We find that cortical responses in a forward suppression paradigm are more diverse in waking mice than previously appreciated, that these responses vary between cells with different firing characteristics and waveform shapes, but that the variability in these responses is not substantially related to cortical depth or columnar location. Moreover, responses to the first tone in the sequence are often not linearly related to the suppression of the second tone response, suggesting that spike-frequency adaptation of cortical cells is not a large contributor to forward suppression or its variability. Instead, we use a simple multilayered model to show that cell-to-cell differences in the balance of intracortical inhibition and excitation will naturally produce such a diversity of forward interactions. We propose that diverse inhibitory connectivity allows the cortex to encode spectro-temporally fluctuating stimuli in multiple parallel ways.NEW & NOTEWORTHY Behavioral and neural responses to auditory stimuli are profoundly influenced by recent sounds, yet how this occurs is not known. Here, the authors show in the auditory cortex of awake mice that the quality of history-dependent effects is diverse and related to cell type, response latency, firing rates, and receptive field bandwidth. In a cortical model, differences in excitatory-inhibitory balance can produce this diversity, providing the cortex with multiple ways of representing temporally complex information.

Keywords: auditory cortex; forward suppression; stimulus history.


Figures

Fig. 1.
Fig. 1.
Measuring contextual interactions using a sequential forward suppression paradigm. A: forward suppression stimulus in which a masker tone, whose frequency varies from trial to trial, which precedes a probe tone, whose frequency (indicated by the red arrow) is constant. On randomly interleaved trials, called probe alone (PA) trials, the masker tone is omitted. Stimulus A is composed of 20-ms masker and probe tones, separated by a 30-ms gap. B: an example single unit’s response to stimulus A. Left: spike waveform (means ± SD of unit’s action potentials; scale bar is 1 ms). Raster shows spike times relative to the onset of the masker, as a function of masker frequency. Gray and yellow rectangles above raster signify times of masker and probe tones, respectively. Gray and yellow highlighted regions show the 50-ms time periods used to calculate average masker and probe responses, respectively. Red arrow, frequency of probe tone. Right, top: tuning profile (means ± SE of responses to the masker, as a function of masker frequency). Gray diamonds, masker frequencies for which responses significantly exceeded spontaneous. Right, bottom: suppression profile (means ± SE of responses to the probe, as a function of masker frequency). Blue diamonds, masker frequencies for which responses to the probe are significantly suppressed below the PA response. C: the normalized suppression profile, as a function of masker frequency, is produced by dividing the suppression profile by the probe alone response. Remaining response at probe frequency (lower vertical bar) is defined as the normalized probe response at probe frequency. Suppression width (horizontal bar) is measured as the range of masker stimuli, in octaves, that significantly suppress the probe response. Frequency dependence (ω2) is a measure of how strongly the response to the probe depends on the frequency of the masker tone (see materials and methods). D: stimulus B is similar to stimulus A, but composed of 50-ms masker and probe tones with a 20-ms gap between the two. E and F: as B and C. An example single unit’s response to stimulus B shows a relatively large remaining response at probe frequency, modest frequency dependence, and a narrow suppression width. G and H: as B and C. Another example single unit’s response to stimulus B, demonstrating that the highest normalized probe response can be >1 (i.e., the probe alone response).
Fig. 2.
Fig. 2.
Heterogeneous responses in a forward suppression paradigm. A: a single unit, presented with stimulus B, whose probe response is suppressed by a wide range of masker frequencies (blue diamonds). Red arrow indicates frequency of probe tone. B: a single unit, presented with stimulus B, whose probe response is suppressed by a narrow range of masker frequencies (blue diamonds). C: a single unit, presented with stimulus A, whose probe response is facilitated by a narrow range of masker stimuli (orange diamonds). D: a single unit, presented with stimulus A, whose probe response is facilitated by some masker frequencies (orange diamonds), and suppressed by others (blue diamonds), showing a mixed effect. E and F: single units, presented with stimulus A, whose probe responses are not significantly affected by the prior presentation of a masker stimulus, and therefore are neither suppressed nor facilitated.
Fig. 3.
Fig. 3.
Forward suppression is similar between units presented with stimulus A (stim A) or stimulus B (stim B). A: percentages of all units presented with either stimulus A (left; n = 123) or stimulus B (right; n = 67) that were suppressed (stim A: 75 units; stim B: 44 units), facilitated (stim A: 14 units; stim B: 4 units), mixed (both suppressed and facilitated; stim A: 1 unit; stim B: 1 unit), or neither suppressed nor facilitated (stim A: 33 units; stim B: 14 units). These proportions are not different between stimulus A and stimulus B (Fisher’s exact test, P = 0.49). B: stacked distributions of remaining responses at probe frequency for units presented with stimulus A (left) or stimulus B (right). The remaining responses of all units are not significantly different between stimulus types (upward and downward bars; stim A: median remaining response = 0.7 ± 0.44; stim B: median remaining response = 0.61 ± 0.34; rank-sum, P = 0.11), nor are those among only suppressed/mixed units (upward bars; stim A: median remaining response = 0.54 ± 0.33; stim B: median remaining response = 0.55 ± 0.27; rank-sum, P = 0.91). C: stacked distributions of suppression widths for units with suppression widths >0 (i.e., suppressed/mixed units), presented with either stimulus A (left; n = 76) or stimulus B (right; n = 45). D: stacked distributions of frequency dependence for units presented with stimulus A (left) or stimulus B (right).
Fig. 4.
Fig. 4.
Latencies, evoked firing rates (FR), and spontaneous firing rates are related to the prevalence and quality of forward suppression. A, left: example single unit’s waveform (means ± SD) and spike raster. Green horizontal bar denotes trials when the masker tone was at the best frequency (BF). Red arrow, probe frequency. Middle: spikes are pooled across responses to the BF (from green trials in left diagram) and binned by 1 ms to create a peri-stimulus time histogram. Response latency is the time when evoked responses reach 3 standard deviations above spontaneous activity. Right: response to the masker and probe as a function of masker frequency. Spontaneous firing rate is defined as the average firing rate during the 50-ms period before the probe alone stimulus, while the firing rate at BF is defined as the average firing rate in the 50-ms period during which the BF is played. B: proportion of suppressed (blue), facilitated (orange), mixed (purple), and neither suppressed nor facilitated units (gray), as a function of response onset latency at BF. C: correlation of response latency with remaining response at probe frequency (top), suppression width (middle), and frequency dependence (bottom) (n = 190). Circles, units presented with stimulus A; diamonds, units presented with stimulus B; blue, suppressed units; orange, facilitated units; purple, mixed units; gray, units with neither effect. D: as B, as a function of evoked firing rate at BF. E: as C. Correlation of firing rate at BF with remaining response at probe frequency (top), frequency dependence (middle), and suppression width (bottom). F: as B, as a function of spontaneous firing rate. G: as C. Correlation of spontaneous firing rate with remaining response at probe frequency (top), suppression width (middle), and frequency dependence (bottom).
Fig. 5.
Fig. 5.
Narrow-spiking units exhibit forward suppression more often than broad-spiking units. A: example single unit waveform (means ± SD). Peak-to-trough ratio is the peak height divided by the trough height, while the peak-to-trough duration is the time from the trough height to the peak height. B: peak-to-trough ratio as a function of peak-to-trough duration for all tuned units (n = 190). Narrow-spiking units (magenta) are defined by a peak-to-trough duration of ≤ 0.45 ms. Broad-spiking units (dark blue) are defined by a peak-to-trough duration of >0.45 ms. C: percentage of narrow-spiking (left) and broad-spiking (right) units that are suppressed, facilitated, mixed, or neither suppressed nor facilitated. Percentages are significantly different between narrow-spiking and broad-spiking units (Fischer’s exact test, P = 0.013).
Fig. 6.
Fig. 6.
Suppression quality is variable across cortical depth and between neighboring units. A: proportion of suppressed (blue), facilitated (orange), mixed (purple), and neither suppressed nor facilitated units (gray), as a function of cortical depth. B: correlation of cortical depth with remaining response at probe frequency (top), suppression width (middle), and frequency dependence (bottom) for all units whose approximate depth from the cortical surface was recorded (n = 115). Units were divided into 8 nonoverlapping groups, each spanning 100 μm of the cortical depth. The white rectangles and black bars represent means ± SE for these groups. Circles, units presented with stimulus A; diamonds, units presented with stimulus B; blue, suppressed units; orange, facilitated units; purple, mixed units; gray, units with neither effect. C: comparison of remaining responses at probe frequency (top), suppression widths (middle), and frequency dependences (bottom) between neighboring pairs of simultaneously recorded units (n = 137 pairs). The deeper units within pairs are plotted on the x-axis. A unit may be represented more than once if it was recorded at the same time as more than one other unit. Circles, units presented with stimulus A; diamonds, units presented with stimulus B; blue, deeper unit is suppressed; orange, deeper unit is facilitated; purple, deeper unit is mixed; gray, deeper unit shows neither effect. ns, Not significant.
Fig. 7.
Fig. 7.
Quality of forward suppression depends on the spectral distance between probe tone and best frequency. A, left: raster of an example unit in which the probe (P) frequency (red arrow) is the same as best frequency (BF, green arrow). Right: In this unit, the response to the probe alone (PA) is relatively strong, and the probe response is broadly and deeply suppressed. B, left: raster of an example unit in which the probe frequency (red arrow) is 1.8 octaves from BF (green arrow). Right: in this unit, the response to the PA is relatively weak, and the probe response is facilitated. C: proportion of suppressed (blue), facilitated (orange), mixed (purple), and neither suppressed nor facilitated units (gray) as a function of BF – P distance. D: correlation of BF – P distance with remaining response at probe frequency (top), suppression width (middle), and frequency dependence (bottom). E: as C, as a function of the PA response. F: as D. Correlation of the PA response with remaining response at probe frequency (top), suppression width (middle), and frequency dependence (bottom).
Fig. 8.
Fig. 8.
Units with broader frequency tuning show broader suppression. A: an example unit with broad tuning to the masker (measured as the range of masker frequencies, in octaves, that elicits a significant response) whose response to the probe is suppressed by a wide range of masker frequencies. B: an example unit with narrow tuning to the masker whose response to the probe is suppressed by a narrow range of masker frequencies. C: proportion of suppressed (blue), facilitated (orange), mixed (purple), and neither suppressed nor facilitated units (gray), as a function of masker tuning width. D: correlation of tuning width with remaining response at probe frequency (top), suppression width (middle), and frequency dependence (bottom) for all tuned units (n = 190). Circles, units presented with stimulus A; diamonds, units presented with stimulus B; blue, suppressed units; orange, facilitated units; purple, mixed units; gray, units with neither effect.
Fig. 9.
Fig. 9.
Probe responses often do not linearly relate to masker responses. A: means ± SE of response to the masker (black) and probe (blue) as a function of masker frequency for an example suppressed unit. Red arrow, probe frequency. B: linearly regressing the probe and masker responses reveals whether and to what extent the masker and probe responses are linearly related. In this example unit, an R2 of 0.93 indicates a good linear fit and a slope of −0.76 indicates that the range of probe responses was nearly that of the masker responses. C and D: as A and B. In this suppressed example unit, an R2 of 0.45 indicates a mediocre linear fit and a slope (m) of −0.50 indicates that the range of probe responses was half the range of masker responses. E and F: as A and B. In this example unit with no significant effect on the probe response, an R2 of 0 indicates a poor linear fit and a slope of −0.34 indicates that the range of probe responses was a third of the range of masker responses. G: distribution of R2 values for suppressed units (blue), facilitated units (orange), mixed units (purple), and units with no effect (gray). Most units do not exhibit high R2 values (all units, n = 190: median R2 = 0.41 ± 0.48; only suppressed/mixed units, n = 121: median R2 = 0.5 ± 0.46), indicating that the relationship between the probe responses and masker responses is more complex than a linear model would predict. H: as G, for the distribution of slope values. Median slope values >−1 (all units: median slope = −0.51 ± 0.41; only suppressed/mixed units: median slope = −0.59 ± 0.36) indicate that the probe responses of almost all units have a smaller range than masker responses.
Fig. 10.
Fig. 10.
Changing the ratio of excitation and inhibition alters forward suppression in a network with synaptic depression. A: schematic of the linear threshold model containing three layers of neurons: “thalamic” neurons (hexagons) in the first layer, excitatory “pyramidal” neurons (triangles) and inhibitory “interneurons” (squares) in the second layer, and a “cortical output” neuron (big triangle) in the third layer. The frequency preference of each neuron is indicated by its color. B, top: the responses of each thalamic neuron to masker tones, as a function of masker frequency (in units of octaves from the probe frequency). Bottom: the responses of each thalamic neuron to the probe alone (PA; circles), and to the probe tone as a function of masker frequency (lines). Thalamic neurons with the probe frequency in their receptive fields (e.g., middle, green) respond to the probe tone, but these responses are not forward suppressed. C: as B, for the pyramidal neurons and interneurons in the second layer, which receive depressing inputs from the thalamic neurons. Interneurons are more broadly tuned than pyramidal neurons and therefore often have higher responses to the PA. D: schematic of a network with weak inhibitory synaptic connections onto the cortical output neuron. E, left: the cortical output neuron receives tuned excitation in response to the masker, and depressed excitation in response to the probe. Middle: the cortical output neuron receives tuned, but weak, inhibition in response to the masker, and depressed and weak inhibition in response to the probe. Right: the net output of the cortical output neuron shows relatively strong forward suppression. F and G: as D and E, with intermediate inhibitory synaptic strength. H and I: as F and G, with strong inhibitory synaptic connections. J: normalized suppression curves of the cortical output neuron with either weak (left), intermediate (middle), or strong (right) inhibitory synaptic strength show strong forward suppression (left), weak forward suppression (middle), or a combination of forward suppression with forward facilitation (right).

Similar articles

Cited by

References

    1. Abolafia JM, Vergara R, Arnold MM, Reig R, Sanchez-Vives MV. Cortical auditory adaptation in the awake rat and the role of potassium currents. Cereb Cortex 21: 977–990, 2011. doi:10.1093/cercor/bhq163. - DOI - PubMed
    1. Allman J, Miezin F, McGuinness E. Stimulus specific responses from beyond the classical receptive field: neurophysiological mechanisms for local-global comparisons in visual neurons. Annu Rev Neurosci 8: 407–430, 1985. doi:10.1146/annurev.ne.08.030185.002203. - DOI - PubMed
    1. Anderson JS, Carandini M, Ferster D. Orientation tuning of input conductance, excitation, and inhibition in cat primary visual cortex. J Neurophysiol 84: 909–926, 2000. - PubMed
    1. Anis NA, Berry SC, Burton NR, Lodge D. The dissociative anaesthetics, ketamine and phencyclidine, selectively reduce excitation of central mammalian neurones by N-methyl-aspartate. Br J Pharmacol 79: 565–575, 1983. doi:10.1111/j.1476-5381.1983.tb11031.x. - DOI - PMC - PubMed
    1. Antkowiak B. Different actions of general anesthetics on the firing patterns of neocortical neurons mediated by the GABA(A) receptor. Anesthesiology 91: 500–511, 1999. doi:10.1097/00000542-199908000-00025. - DOI - PubMed

Publication types

LinkOut - more resources