

Visceral adipose tissue activated macrophage content and inflammatory adipokine secretion is higher in pre-eclampsia than in healthy pregnancys
- PMID: 28566469
- PMCID: PMC6376613
- DOI: 10.1042/CS20160832
Visceral adipose tissue activated macrophage content and inflammatory adipokine secretion is higher in pre-eclampsia than in healthy pregnancys
Abstract
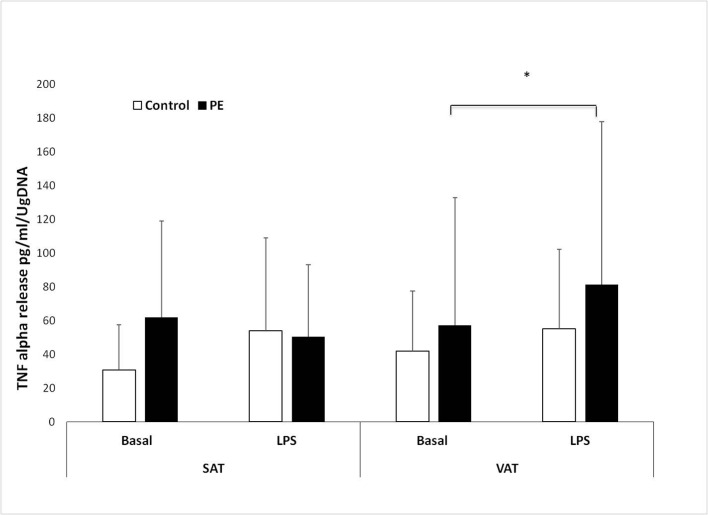
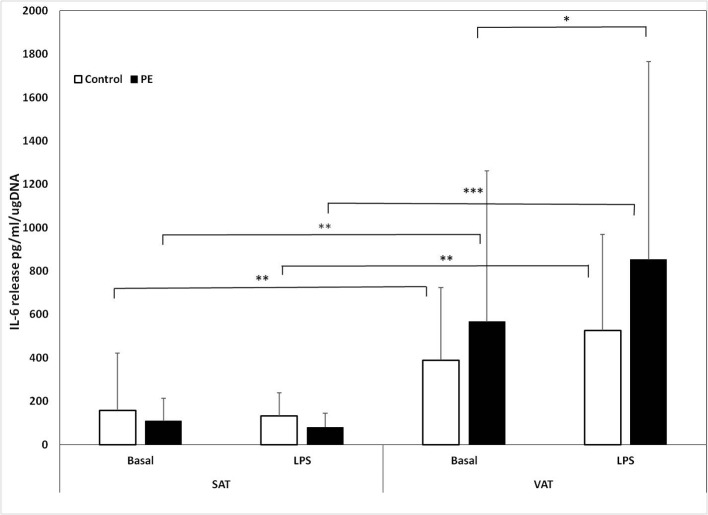
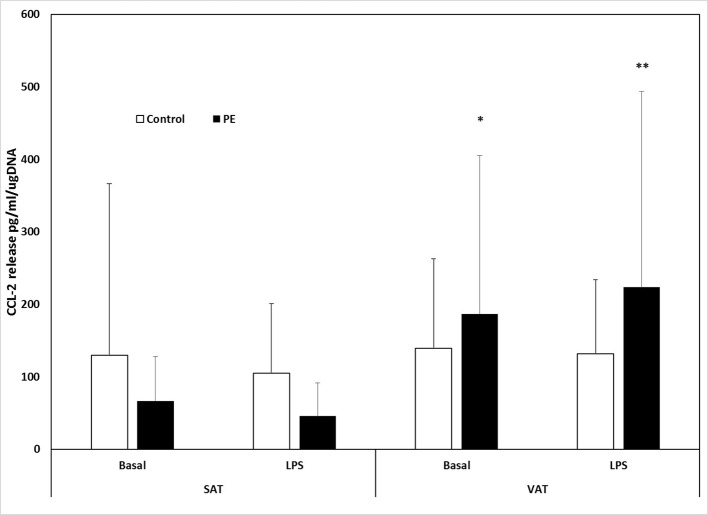
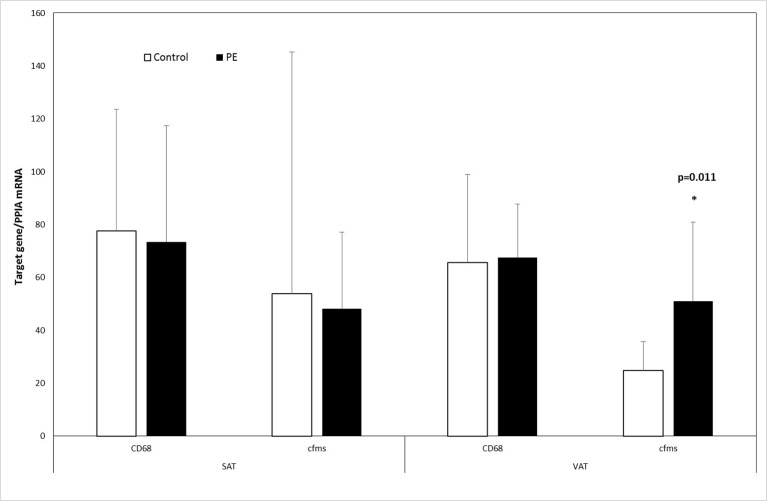
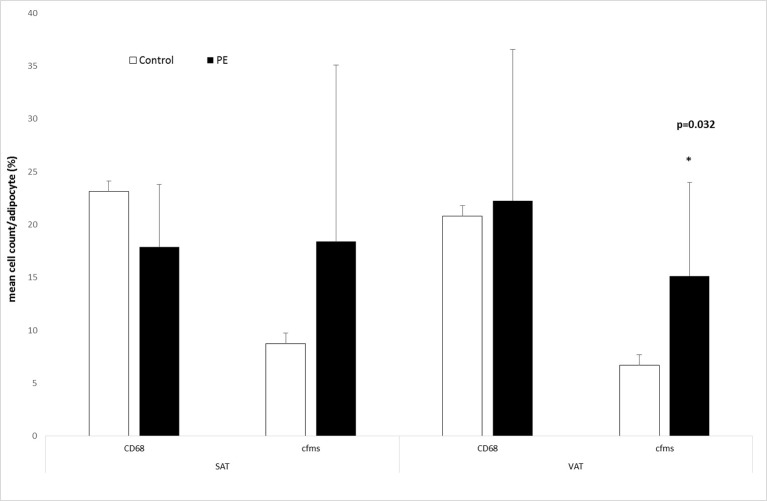
Obesity increases pre-eclampsia (PE) risk. Adipose tissue inflammation may contribute to the clinical syndrome of PE. We compared adipose tissue macrophage infiltration and release of pro-inflammatory adipokines in PE and healthy pregnancy. Subcutaneous and visceral adipose tissue biopsies were collected from healthy (n=13) and PE (n=13) mothers. Basal and lipopolysaccharide (LPS) stimulated adipocyte TNFα, IL-6, CCL-2, and CRP release was measured. Adipose tissue cell densities of activated (cfms+) and total (CD68+) macrophages were determined. In PE only, visceral adipose tissue TNFα release was increased after LPS stimulation (57 [76] versus 81 [97] pg/ml/µg DNA, P=0.030). Basal TNFα release was negatively correlated insulin sensitivity of visceral adipocytes (r = -0.61, P=0.030) in PE. Visceral adipocyte IL-6 release was increased after LPS stimulation in PE only (566 [696] versus 852 [914] pg/ml/µg DNA, P=0.019). Visceral adipocyte CCL-2 basal (67 [61] versus 187 [219] pg/ml/µgDNA, P=0.049) and stimulated (46 [46] versus 224 [271] pg/ml/µg DNA, P=0.003) release was greater than in subcutaneous adipocytes in PE only. In PE, median TNF mRNA expression in visceral adipose tissue was higher than controls (1.94 [1.13-4.14] versus 0.8 [0.00-1.27] TNF/PPIA ratio, P=0.006). In visceral adipose tissue, CSF1R (a marker of activated macrophages) mRNA expression (24.8[11.0] versus 51.0[29.9] CSF1R/PPIA ratio, P=0.011) and activated (cfms+) macrophage count (6.7[2.6] versus 15.2[8.8] % cfms+/adipocyte, P=0.031) were higher in PE than in controls. In conclusion, our study demonstrates dysregulation of inflammatory pathways predominantly in visceral adipose tissue in PE. Inflammation of visceral adipose tissue may mediate many of the adverse metabolic effects associated with PE.
Keywords: adipocytes; adipokines; preeclampsia; pregnancy.
© 2017 The Author(s). This is an open access article published by Portland Press Limited on behalf of the Biochemical Society and distributed under the Creative Commons Attribution License 4.0 (CC BY).
Conflict of interest statement
The authors declare that there are no competing interests associated with the manuscript.
Figures
References
-
- Freeman D.J., McManus F., Brown E.A., Cherry L., Norrie J., Ramsay J.E. et al. (2004) Short- and long-term changes in plasma inflammatory markers associated with preeclampsia. Hypertension 44, 708–714 - PubMed
-
- von Versen-Hoeynck F.M. and Powers R.W. (2007) Maternal-fetal metabolism in normal pregnancy and preeclampsia. Front. Biosci. 12, 2457–2470 - PubMed
-
- Hotamisligil G.S., Shargill N.S. and Spiegelman B.M. (1993) Adipose expression of tumor necrosis factor-alpha: direct role in obesity-linked insulin resistance. Science 259, 87–91 - PubMed
-
- Huda S.S., Forrest R., Paterson N., Jordan F., Sattar N., Freeman D.J. et al. (2014) In preeclampsia, maternal third trimester subcutaneous adipocyte lipolysis is more resistant to suppression by insulin than in healthy pregnancy. Hypertension 63, 1094–1101 - PubMed
MeSH terms
Substances
LinkOut - more resources
Full Text Sources
Other Literature Sources
Research Materials
Miscellaneous