

B1 Power Optimization for Chemical Exchange Saturation Transfer Imaging: A Phantom Study Using Egg White for Amide Proton Transfer Imaging Applications in the Human Brain
- PMID: 28566586
- PMCID: PMC5760238
- DOI: 10.2463/mrms.tn.2016-0069
B1 Power Optimization for Chemical Exchange Saturation Transfer Imaging: A Phantom Study Using Egg White for Amide Proton Transfer Imaging Applications in the Human Brain
Abstract
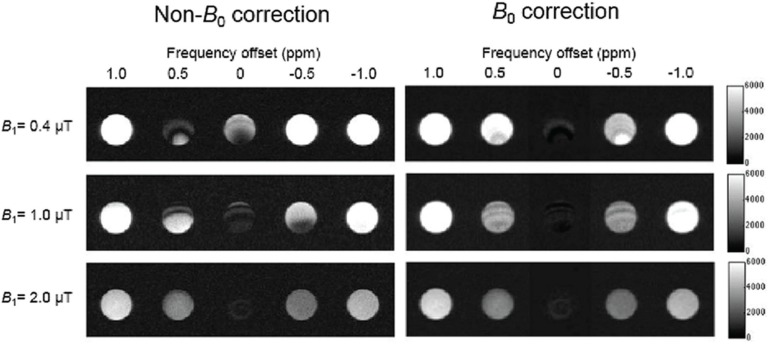
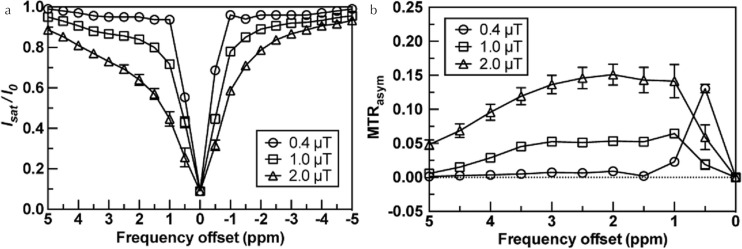
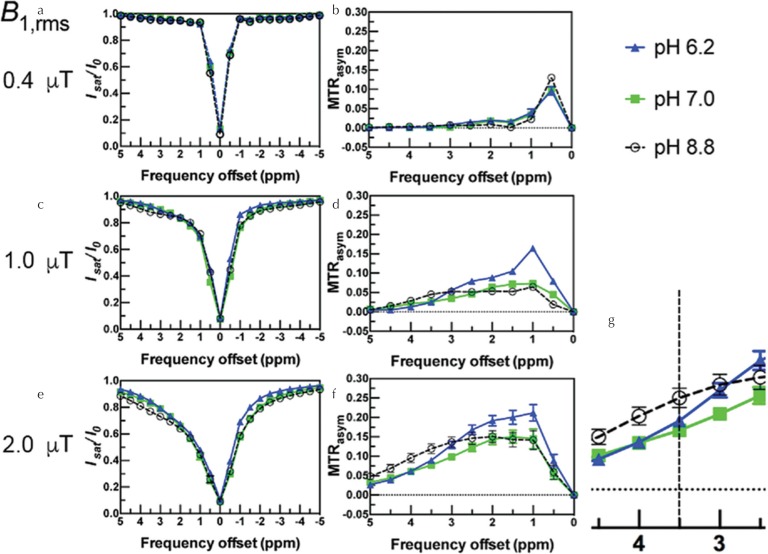
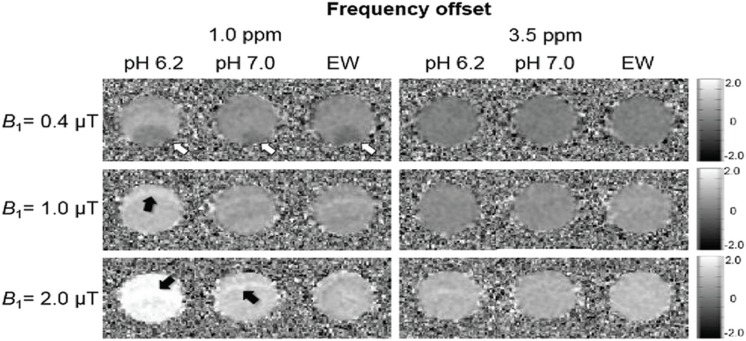
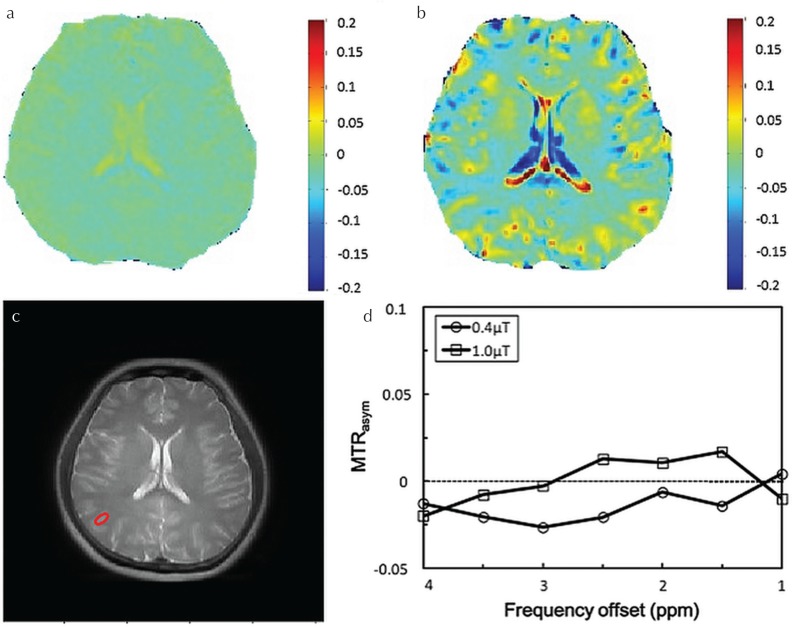
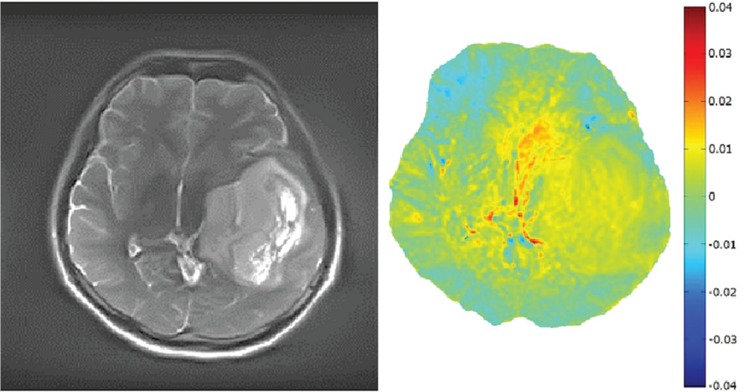
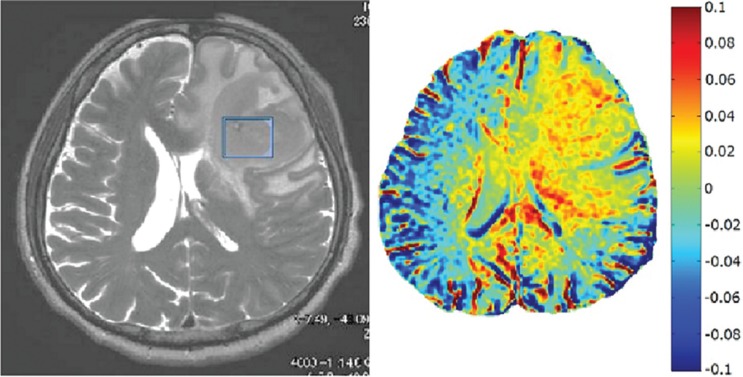
The chemical exchange saturation transfer (CEST) effect on an egg white (EW) suspension was investigated for optimization of magnetization transfer (MT) power (B1,rms) and pH dependency with the addition of lactic acid. Applying a higher MT pulse, B1,rms, Z-spectrum shows higher asymmetry and the magnetisation transfer ratio (MTR)asym signal increases to around 1-3.5 ppm, indicating a higher CEST effect. Amide proton transfer (APT) at 3.5 ppm shows a signal elevation in MTRasym with the application of higher B1,rms power and high pH. In addition, the hydroxyl proton signal in MTRasym increases as pH is reduced by lactic acid. In Z-spectrum of B1,rms at 1.0 μT and 2.0 μT, the dependence on CEST effect of amide proton and hydroxyl proton could be observed by using an EW suspension phantom. The CEST MT power was optimized on the EW suspension phantom with pH dependency and further confirmed on volunteers. In addition, APT imaging at 3.5 ppm using B1,rms at 1.0 μT performed on two human brains with different pathophysiological conditions indicated appropriate ATP effect.
Keywords: B0 correction; B1 power; amide proton transfer; amide proton transfer effect on human brain; chemical exchange saturation transfer; egg white; pH dependency.
Conflict of interest statement
Naotaka Sakashita and Mitsue Miyazaki are employees of Toshiba Medical Systems. All others have no conflict of interest.
Figures
Similar articles
-
Systematic Evaluation of Amide Proton Chemical Exchange Saturation Transfer at 3 T: Effects of Protein Concentration, pH, and Acquisition Parameters.Invest Radiol. 2016 Oct;51(10):635-46. doi: 10.1097/RLI.0000000000000292. Invest Radiol. 2016. PMID: 27272542
-
Amide proton transfer imaging of glioblastoma, neuroblastoma, and breast cancer cells on a 11.7 T magnetic resonance imaging system.Magn Reson Imaging. 2019 Oct;62:181-190. doi: 10.1016/j.mri.2019.07.005. Epub 2019 Jul 11. Magn Reson Imaging. 2019. PMID: 31302222
-
Effect of the saturation pulse duration on chemical exchange saturation transfer in amide proton transfer MR imaging: a phantom study.Radiol Phys Technol. 2016 Jan;9(1):15-21. doi: 10.1007/s12194-015-0326-1. Epub 2015 Jun 23. Radiol Phys Technol. 2016. PMID: 26099607
-
Amide proton transfer imaging of tumors: theory, clinical applications, pitfalls, and future directions.Jpn J Radiol. 2019 Feb;37(2):109-116. doi: 10.1007/s11604-018-0787-3. Epub 2018 Oct 19. Jpn J Radiol. 2019. PMID: 30341472 Review.
-
Magnetization Transfer Contrast and Chemical Exchange Saturation Transfer MRI. Features and analysis of the field-dependent saturation spectrum.Neuroimage. 2018 Mar;168:222-241. doi: 10.1016/j.neuroimage.2017.04.045. Epub 2017 Apr 21. Neuroimage. 2018. PMID: 28435103 Free PMC article. Review.
Cited by
-
APT Weighted MRI as an Effective Imaging Protocol to Predict Clinical Outcome After Acute Ischemic Stroke.Front Neurol. 2018 Oct 23;9:901. doi: 10.3389/fneur.2018.00901. eCollection 2018. Front Neurol. 2018. PMID: 30405523 Free PMC article.
-
Simplified assessment for chemical exchanged saturation transfer (CEST) imaging: local offset frequency and CEST effect.Radiol Phys Technol. 2024 Mar;17(1):93-102. doi: 10.1007/s12194-023-00752-z. Epub 2023 Oct 28. Radiol Phys Technol. 2024. PMID: 37897684
-
MR Imaging in the 21st Century: Technical Innovation over the First Two Decades.Magn Reson Med Sci. 2022 Mar 1;21(1):71-82. doi: 10.2463/mrms.rev.2021-0011. Epub 2021 Apr 16. Magn Reson Med Sci. 2022. PMID: 33867419 Free PMC article. Review.
-
Non-invasive Amide Proton Transfer Imaging and ZOOM Diffusion-Weighted Imaging in Differentiating Benign and Malignant Thyroid Micronodules.Front Endocrinol (Lausanne). 2018 Dec 12;9:747. doi: 10.3389/fendo.2018.00747. eCollection 2018. Front Endocrinol (Lausanne). 2018. PMID: 30631303 Free PMC article.
-
Advancing clinical MRI exams with artificial intelligence: Japan's contributions and future prospects.Jpn J Radiol. 2025 Mar;43(3):355-364. doi: 10.1007/s11604-024-01689-y. Epub 2024 Nov 16. Jpn J Radiol. 2025. PMID: 39548049 Free PMC article. Review.
References
-
- Liepinsh E, Otting G. Proton exchange rates from amino acid side chains—implications for image contrast. Magn Reson Med 1996; 35:30–42. - PubMed
-
- Ward KM, Aletras AH, Balaban RS. A new class of contrast agents for MRI based on proton chemical exchange dependent saturation transfer (CEST). J Magn Reson 2000; 143:79–87. - PubMed
-
- Zhou J, Payen JF, Wilson DA, Traystman RJ, van Zijl PC. Using the amide proton signals of intracellular proteins and peptides to detect pH effects in MRI. Nat Med 2003; 9:1085–1090. - PubMed
-
- Zhou J, Lal B, Wilson DA, Laterra J, van Zijl PC. Amide proton transfer (APT) contrast for imaging of brain tumors. Magn Reson Med 2003; 50:1120–1126. - PubMed
MeSH terms
Substances
LinkOut - more resources
Full Text Sources
Other Literature Sources
Medical