. 2017 May 17:11:281.
doi: 10.3389/fnins.2017.00281. eCollection 2017.

Time to Amyloid Positivity and Preclinical Changes in Brain Metabolism, Atrophy, and Cognition: Evidence for Emerging Amyloid Pathology in Alzheimer's Disease

Affiliations

Time to Amyloid Positivity and Preclinical Changes in Brain Metabolism, Atrophy, and Cognition: Evidence for Emerging Amyloid Pathology in Alzheimer's Disease

Philip S Insel et al. Front Neurosci. .

Abstract

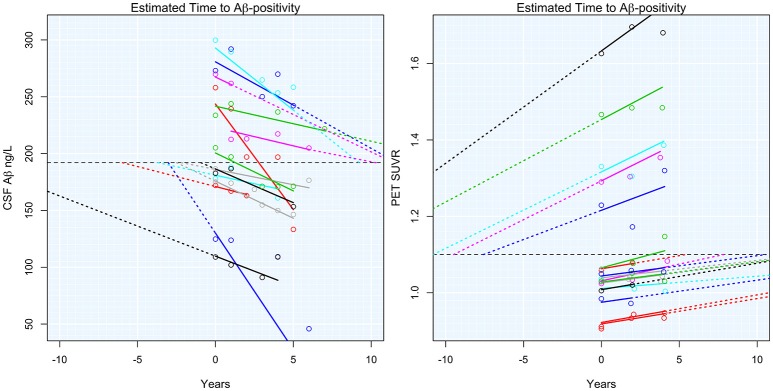
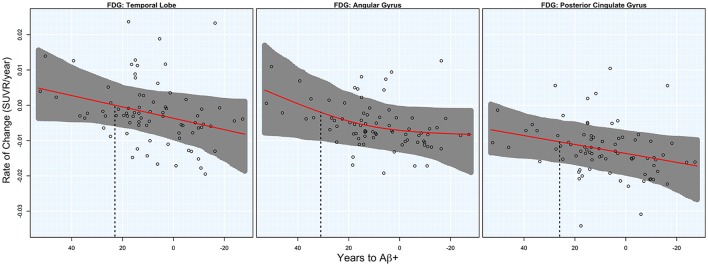
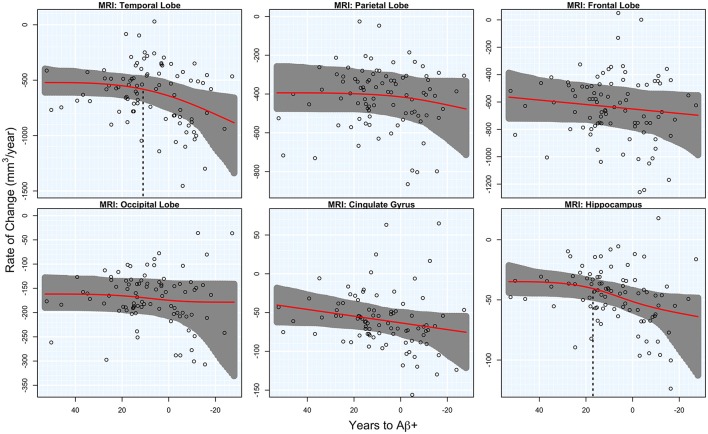
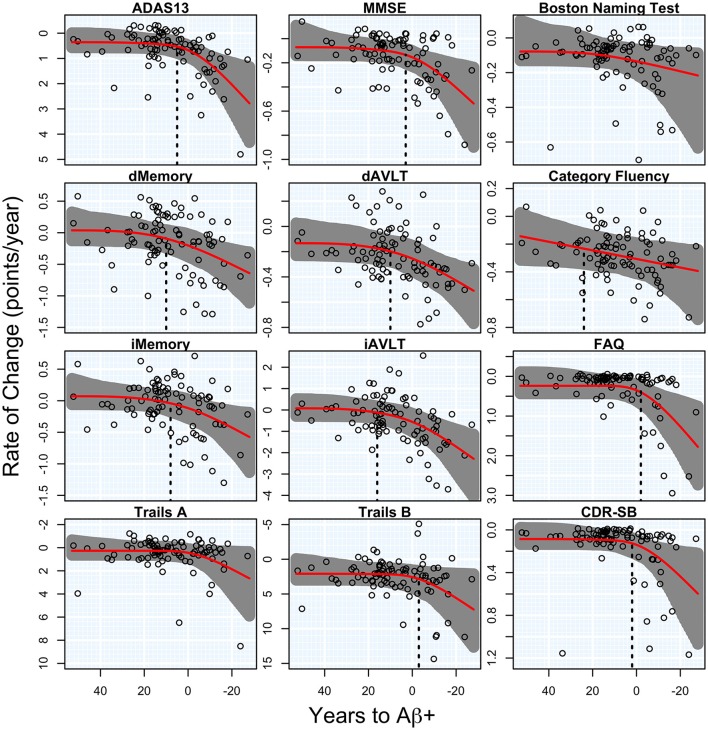
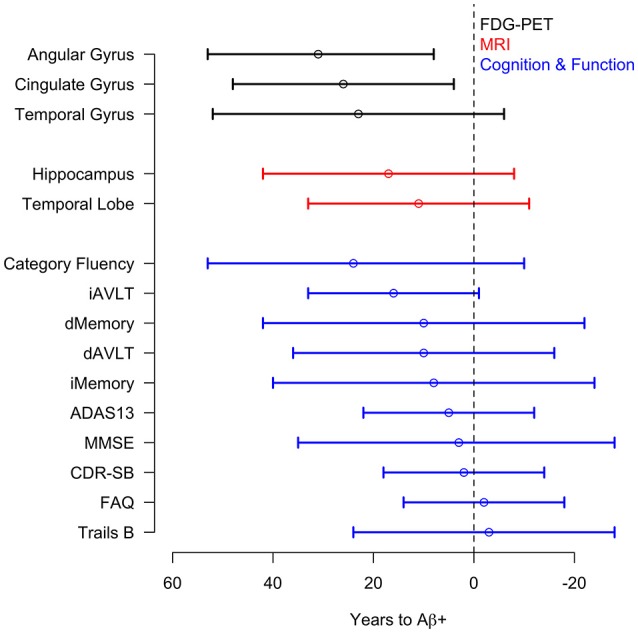
Background: Aβ pathology is associated with longitudinal changes of brain metabolism, atrophy, and cognition, in cognitively healthy elders. However, Aβ information is usually measured cross-sectionally and dichotomized to classify subjects as Aβ-positive or Aβ-negative, making it difficult to evaluate when brain and cognitive changes occur with respect to emerging Aβ pathology. In this study, we use longitudinal Aβ information to combine the level and rate of change of Aβ to estimate the time to Aβ-positivity for each subject and test this temporal proximity to significant Aβ pathology for associations with brain structure, metabolism, and cognition. Methods: In 89 cognitively healthy elders with up to 10 years of follow-up, we estimated the points at which rates of fluorodeoxyglucose (FDG) PET, MRI, and cognitive and functional decline begin to accelerate with respect to the time to Aβ-positivity. Points of initial acceleration in rates of decline were estimated using mixed-effects models with penalized regression splines. Results: Acceleration of rates of FDG PET were observed to occur 20+ years before the conventional threshold for Aβ-positivity. Subtle signs of cognitive dysfunction were observed 10+ years before Aβ-positivity. Conclusions: Aβ may have subtle associations with other hallmarks of Alzheimer's disease before Aβ biomarkers reach conventional thresholds for Aβ-positivity. Therefore, we propose that emerging Aβ pathology occurs many years before cognitively healthy elders reach the current threshold for Aβ positivity (preclinical AD). To allow prevention in the earliest disease stages, AD clinical trials may be designed to also include subjects with Aβ biomarkers in the sub-threshold range.

Keywords: Alzheimer's disease; atrophy; cognition; metabolism; preclinical; β-amyloid.


Figures

Figure 1
Figure 1
Estimated time to Aβ-positivity. Subject-specific estimated slopes of either CSF Aβ or PET Aβ are plotted against the time from baseline. Dashed colored lines show the projected time to or from Aβ-positivity. The horizontal dashed black lines indicate the threshold for Aβ-positivity.
Figure 2
Figure 2
FDG rates of change. Annual rates of change for FDG PET are plotted against T2Aβ+. Rates worsen from top to bottom and time to Aβ-positivity decreases from left to right. Estimated curves are in red with 95% confidence intervals shaded in gray. The vertical dashed line in black is the estimate of the initial acceleration point.
Figure 3
Figure 3
MRI rates of change. Annual rates of change of MRI regions are plotted against T2Aβ+. Atrophy rates increase from top to bottom and time to Aβ-positivity decreases from left to right. Estimated curves are in red with 95% confidence intervals shaded in gray. The vertical dashed line in black is the estimate of the initial acceleration point, if it exists.
Figure 4
Figure 4
Cognitive and functional rates of change. Annual rates of change for cognitive and functional measures are plotted against time to Aβ-positivity. Rates of cognition or function worsen from top to bottom and time to Aβ-positivity decreases from left to right. Estimated curves are in red with 95% confidence intervals shaded in gray. The vertical dashed line in black is the estimate of the initial acceleration point, if it exists.
Figure 5
Figure 5
Acceleration point estimates and 95% confidence intervals. Estimates of the initial acceleration points and 95% confidence intervals for all outcomes are plotted against T2Aβ+. Time to Aβ-positivity decreases from left to right.

References

    1. Bourgeat P., Chételat G., Villemagne V. L., Fripp J., Raniga P., Pike K., et al. (2010). β-Amyloid burden in the temporal neocortex is related to hippocampal atrophy in elderly subjects without dementia. Neurology 74, 121–127. 10.1212/WNL.0b013e3181c918b5 - DOI - PubMed
    1. Braak H., Braak E. (1991). Neuropathological stageing of Alzheimer-related changes. Acta Neuropathol. 82, 239–259. 10.1007/BF00308809 - DOI - PubMed
    1. Chételat G., Villemagne V. L., Bourgeat P., Pike K. E., Jones G., Ames D., et al. . (2010). Relationship between atrophy and β-amyloid deposition in Alzheimer disease. Ann. Neurol. 67, 317–324. 10.1002/ana.21955 - DOI - PubMed
    1. Fischl B., Salat D. H., Busa E., Albert M., Dieterich M., Haselgrove C., et al. . (2002). Whole brain segmentation: automated labeling of neuroanatomical structures in the human brain. Neuron 33, 341–355. 10.1016/S0896-6273(02)00569-X - DOI - PubMed
    1. Hardy J., Selkoe D. J. (2002). The amyloid hypothesis of Alzheimers disease: progress and problems on the road to therapeutics. Science 297, 353–356. 10.1126/science.1072994 - DOI - PubMed