. 2017 May 19;8(3):2041669517707766.
doi: 10.1177/2041669517707766. eCollection 2017 May-Jun.

Spatial Frequency Shifts From Counterphase Flicker and From Simultaneous Contrast

Affiliations

Spatial Frequency Shifts From Counterphase Flicker and From Simultaneous Contrast

Sae Kaneko et al. Iperception. .

Abstract

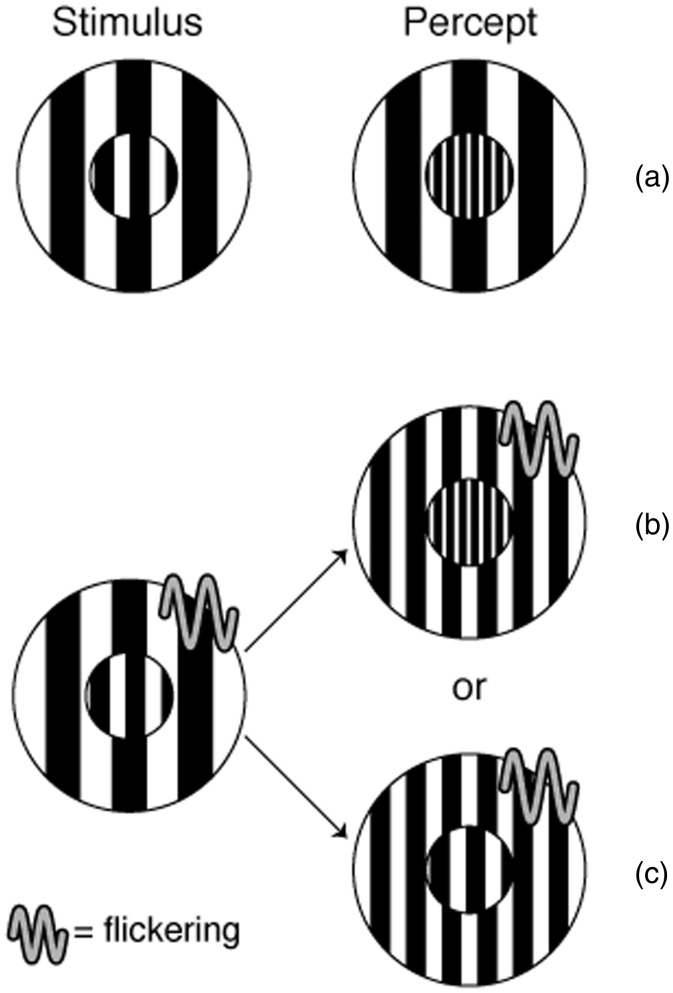
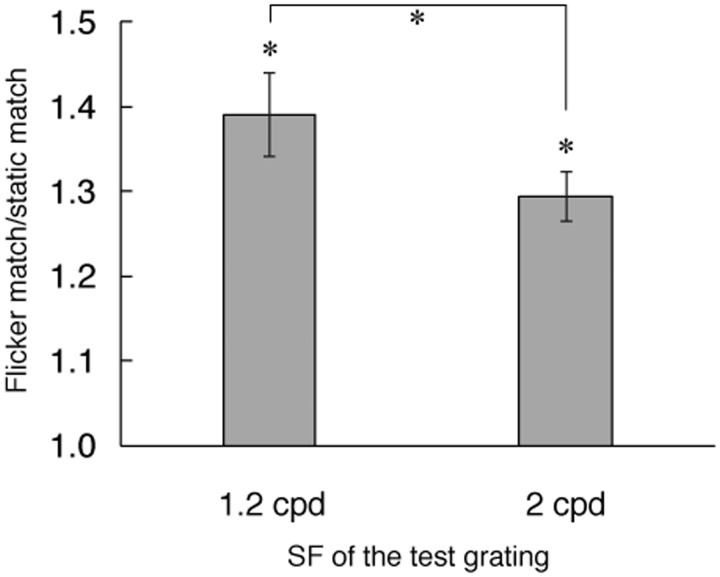
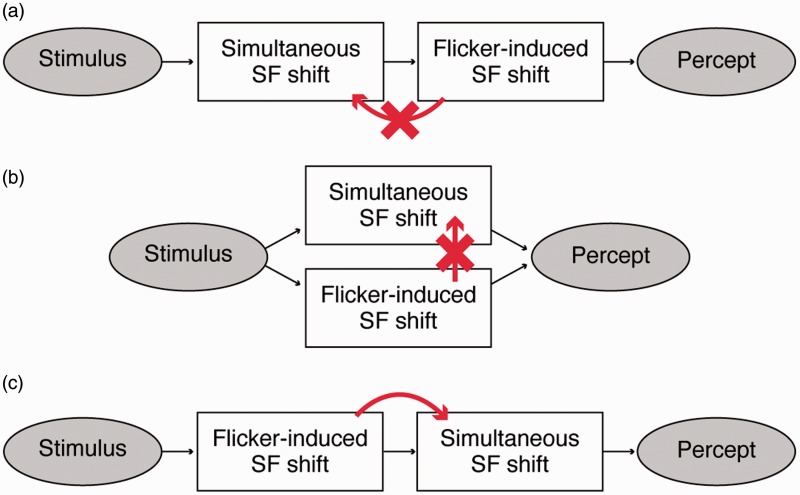
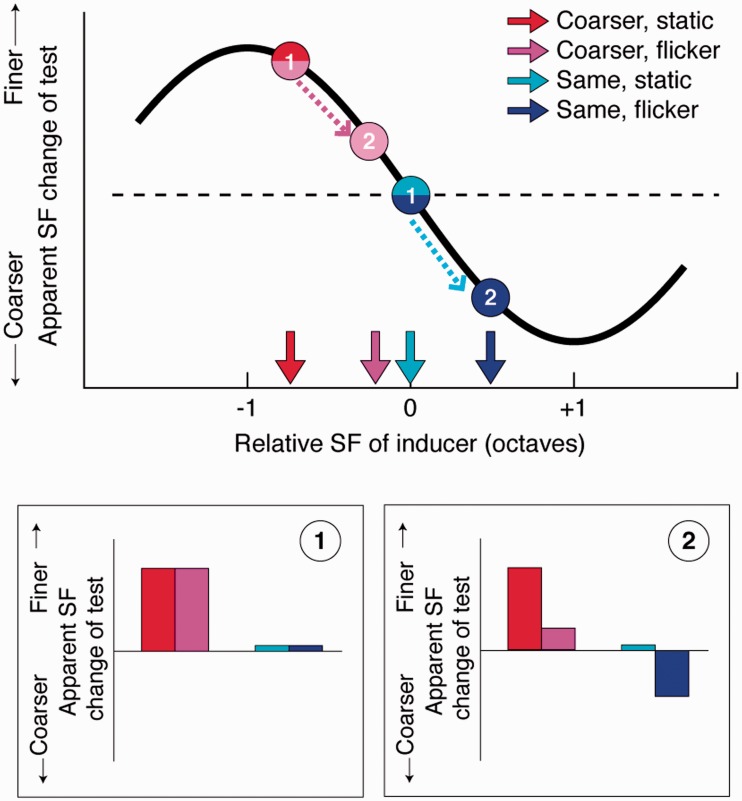
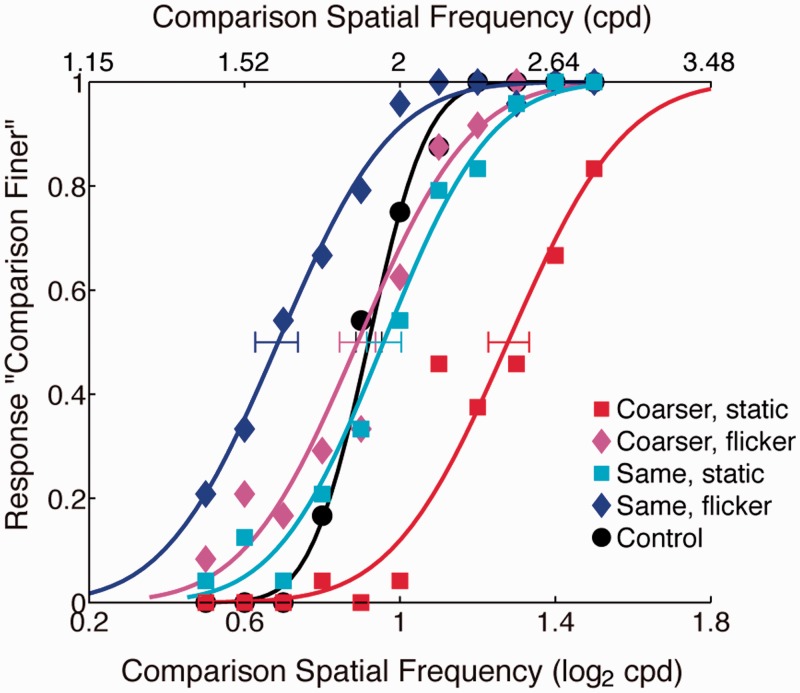
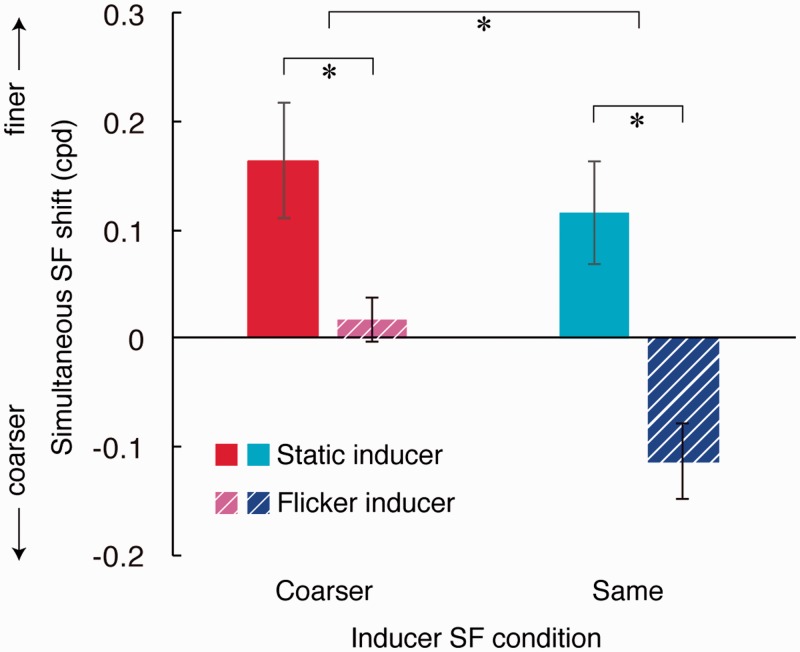
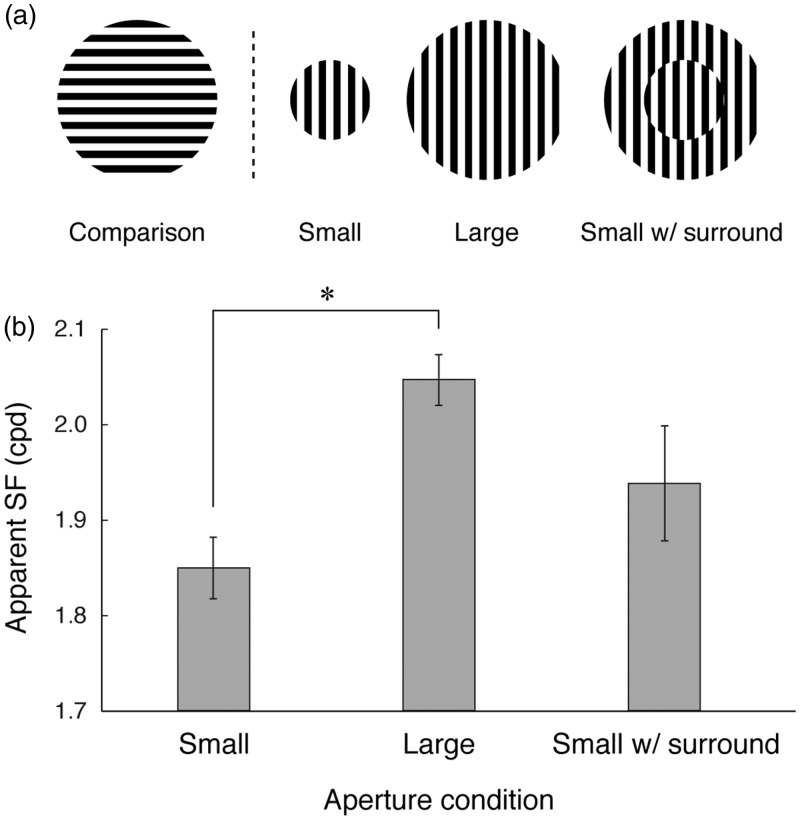
In simultaneous contrast of spatial frequency (SF), a test grating surrounded by a coarser inducing grating looks apparently finer. We combined this effect with another visual illusion; the fact that flickering the inducing grating raises its apparent SF. We found that the inducer's apparent, not physical spatial frequency, drove the simultaneous contrast that it induced into a test grating. Thus, when the inducer was made to flicker, its SF appeared to be higher and consequently, the test's SF appeared lower than before. This suggests that simultaneous contrast of spatial frequency exists further downstream than the flicker-induced increase in perceived SF.

Keywords: flicker; frequency doubling; simultaneous contrast; spatial frequency.


Figures

Figure 1.
Figure 1.
Test appearances predicted when the inducer of same SF is static (a) and flickering (b and c). When the inducer’s SF is lower than that of the test, the test should look finer (a). If the simultaneous contrast depends on the inducer’s physical SF, the test should look the same as in (a) even when the flickering inducer appears finer (b). If the simultaneous contrast depends on the inducer’s apparent SF, the test should, and did, look coarser with the flickering inducer (c) than with the static inducer (a). A wavy line symbol indicates the inducer is flickering.
Figure 2.
Figure 2.
Increase of apparent SF of a flickering grating. A value of 1 means that there was no apparent SF change due to flicker. Mean ± 1 SE for 10 observers. Both increases were significantly greater than 1 (p < .05), also increase was greater for 1.2 cpd than for 2 cpd.
Figure 3.
Figure 3.
Cartoons showing the possible processing orders of flicker-induced SF shift and simultaneous SF shift. If flicker-induced SF shift follows (a), or is independent from (b), simultaneous SF shift, then whether the inducer is static or flickering should have no effect (crossed-out arrows) on simultaneous SF shift. If flicker-induced SF shift precedes simultaneous SF shift (c), then the change in inducer appearance might affect simultaneous SF shift (red arrow). Our results were consistent with (c).
Figure 4.
Figure 4.
Predicted simultaneous SF shift size for different conditions. Top, Arrows along the horizontal axis show the apparent SF of the inducers for four conditions (assuming the +40% increase of the apparent SF increase due to flicker). Black S-shaped curve is derived from Klein et al. (1974) data, showing the relationship between the simultaneous SF shift and the inducer’s SF. The effect peaks when the inducer’s SF is approximately one octave away from the test SF. Note that the apparent SF shift by flicker was smaller than one octave shift. Bottom: If flicker-induced SF shift follows or is independent from simultaneous SF shift (Figure 3(a) and (b)), the physical SF of the inducer should determine the simultaneous SF shift size, therefore there should be no difference between inducers of the same SF (top and bottom, #1). If flicker-induced SF shift does affect and determine the simultaneous SF shift size, then the apparent SF of the inducer matters and flickering inducer should make the test coarser than the static equivalent (top and bottom, #2). Therefore, “coarser, flicker” should yield closer-to-zero effect and “same, flicker” should yield non-zero, coarsening effect. The critical point here is that the test looks always coarser when surrounded by flickering inducer than with static inducer of the same SF in this prediction.
Figure 5.
Figure 5.
Psychometric curves for five inducer conditions in Experiment 2 (one naïve individual’s data). Data points show rates of an observer’s judging comparison gratings as finer than the test (2 cpd). Bluish colors are for conditions with same frequency (2 cpd) inducers. Reddish colors are for conditions with coarser (1.2 cpd) inducers. Black curve is for the control condition with no inducer. Rightward shift of a curve means the test looked finer. Error bars denote 95% CI calculated from 5,000 bootstrap replications.
Figure 6.
Figure 6.
Simultaneous SF shift with various inducers in Experiment 2 (mean ± 1 SE, group data). A positive (negative) value means inducers made the test look finer (coarser). Significant differences are marked with asterisks (p < .05). Results show that flickering the inducer (which made it look finer) made the test gratings look coarser.
Figure 7.
Figure 7.
(a) Schematic description of the three aperture conditions along with the comparison stimulus. Circular aperture size was 2 deg radius for “Small” and 4 deg radius for “Large”, the surround for “Small with surround”, and the comparison. For “Small with surround”, the relative spatial phases of the test (small) and the surround was fixed to two-third cycle difference to visually segregate the two areas. (b) Measured apparent SF of the test grating (2 cpd). Mean of five observers with ± 1 SE.
None
None

Similar articles

References

    1. Anstis S., Casco C. (2006) Induced movement: The flying bluebottle illusion. Journal of Vision 6: 1087–1092. Retrieved from http://journalofvision.org/6/10/8/, doi:10.1167/6.10.8. - PubMed
    1. Blakemore C., Sutton P. (1969) Size adaptation: A new aftereffect. Science 166: 245–247. - PubMed
    1. Blakemore C., Nachmias J., Sutton P. (1970) The perceived spatial frequency shift: Evidence for frequency selective neurons in the human brain. Journal of Physiology 210: 727–750. - PMC - PubMed
    1. Brainard D. H. (1997) The psychophysics toolbox. Spatial Vision 10: 433–436. - PubMed
    1. Chubb C., Sperling G., Solomon J. A. (1989) Texture interactions determine perceived contrast. Proceedings of the National Academy of Sciences USA 86: 9631–9635. - PMC - PubMed

LinkOut - more resources