

Rising prevalence of non-B HIV-1 subtypes in North Carolina and evidence for local onward transmission
- PMID: 28567304
- PMCID: PMC5442504
- DOI: 10.1093/ve/vex013
Rising prevalence of non-B HIV-1 subtypes in North Carolina and evidence for local onward transmission
Abstract
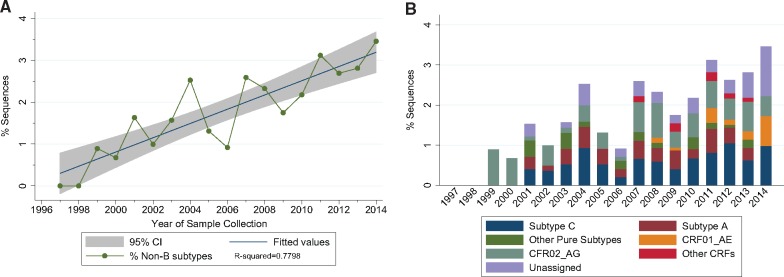
HIV-1 diversity is increasing in North American and European cohorts which may have public health implications. However, little is known about non-B subtype diversity in the southern United States, despite the region being the epicenter of the nation's epidemic. We characterized HIV-1 diversity and transmission clusters to identify the extent to which non-B strains are transmitted locally. We conducted cross-sectional analyses of HIV-1 partial pol sequences collected from 1997 to 2014 from adults accessing routine clinical care in North Carolina (NC). Subtypes were evaluated using COMET and phylogenetic analysis. Putative transmission clusters were identified using maximum-likelihood trees. Clusters involving non-B strains were confirmed and their dates of origin were estimated using Bayesian phylogenetics. Data were combined with demographic information collected at the time of sample collection and country of origin for a subset of patients. Among 24,972 sequences from 15,246 persons, the non-B subtype prevalence increased from 0% to 3.46% over the study period. Of 325 persons with non-B subtypes, diversity was high with over 15 pure subtypes and recombinants; subtype C (28.9%) and CRF02_AG (24.0%) were most common. While identification of transmission clusters was lower for persons with non-B versus B subtypes, several local transmission clusters (≥3 persons) involving non-B subtypes were identified and all were presumably due to heterosexual transmission. Prevalence of non-B subtype diversity remains low in NC but a statistically significant rise was identified over time which likely reflects multiple importation. However, the combined phylogenetic clustering analysis reveals evidence for local onward transmission. Detection of these non-B clusters suggests heterosexual transmission and may guide diagnostic and prevention interventions.
Keywords: HIV-1; molecular epidemiology; southeastern United States; transmission.
Figures


Similar articles
-
Molecular Characterization of HIV-1 Minority Subtypes in Hong Kong: A Recent Epidemic of CRF07_BC among the Men who have Sex with Men Population.Curr HIV Res. 2019;17(1):53-64. doi: 10.2174/1570162X17666190530081355. Curr HIV Res. 2019. PMID: 31142258
-
Characteristics and spread to the native population of HIV-1 non-B subtypes in two European countries with high migration rate.BMC Infect Dis. 2015 Nov 16;15:524. doi: 10.1186/s12879-015-1217-0. BMC Infect Dis. 2015. PMID: 26572861 Free PMC article.
-
High HIV diversity, recombination, and superinfection revealed in a large outbreak among persons who inject drugs in Kentucky and Ohio, USA.Virus Evol. 2024 Feb 19;10(1):veae015. doi: 10.1093/ve/veae015. eCollection 2024. Virus Evol. 2024. PMID: 38510920 Free PMC article.
-
Prevalence of Non-B HIV-1 Subtypes in North Italy and Analysis of Transmission Clusters Based on Sequence Data Analysis.Microorganisms. 2019 Dec 23;8(1):36. doi: 10.3390/microorganisms8010036. Microorganisms. 2019. PMID: 31878069 Free PMC article.
-
Genetic characterization of human immunodeficiency virus type 1 transmission in the Middle East and North Africa.Heliyon. 2017 Jul 10;3(7):e00352. doi: 10.1016/j.heliyon.2017.e00352. eCollection 2017 Jul. Heliyon. 2017. PMID: 28725873 Free PMC article.
Cited by
-
CRF07_BC is associated with slow HIV disease progression in Chinese patients.Sci Rep. 2022 Mar 8;12(1):3773. doi: 10.1038/s41598-022-07518-4. Sci Rep. 2022. PMID: 35260599 Free PMC article.
-
Cross-Continental Dispersal of Major HIV-1 CRF01_AE Clusters in China.Front Microbiol. 2020 Jan 31;11:61. doi: 10.3389/fmicb.2020.00061. eCollection 2020. Front Microbiol. 2020. PMID: 32082287 Free PMC article.
-
National and International Dimensions of Human Immunodeficiency Virus-1 Sequence Clusters in a Northern California Clinical Cohort.Open Forum Infect Dis. 2019 Mar 14;6(4):ofz135. doi: 10.1093/ofid/ofz135. eCollection 2019 Apr. Open Forum Infect Dis. 2019. PMID: 31041344 Free PMC article.
-
Characterization of HIV diversity, phylodynamics and drug resistance in Washington, DC.PLoS One. 2017 Sep 29;12(9):e0185644. doi: 10.1371/journal.pone.0185644. eCollection 2017. PLoS One. 2017. PMID: 28961263 Free PMC article.
-
HIV outcomes among migrants from low-income and middle-income countries living in high-income countries: a review of recent evidence.Curr Opin Infect Dis. 2018 Feb;31(1):25-32. doi: 10.1097/QCO.0000000000000415. Curr Opin Infect Dis. 2018. PMID: 29095720 Free PMC article. Review.
References
-
- Bracho M. A. et al. (2014) ‘Emerging Trends in CRF02_AG Variants Transmission Among Men Who Have Sex With Men in Spain’, Journal of Acquired Immune Deficiency Syndromes, 65/3: e130–3 - PubMed
-
- Brodine S. K. et al. (2003) ‘Diverse HIV-1 Subtypes and Clinical, Laboratory and Behavioral Factors in a Recently Infected US Military Cohort’, Aids, 17/17: 2521–7 - PubMed
-
- Centers for Disease Control Prevention. HIV in the Southern United States CDC Issue Brief <https://www.cdc.gov/hiv/pdf/policies/cdc-hiv-in-the-south-issue-brief.pdf> accessed 12 Jul 2016.
Grants and funding
LinkOut - more resources
Full Text Sources
Other Literature Sources
Molecular Biology Databases
