. 2017 May 11;4(4):e352.
doi: 10.1212/NXI.0000000000000352. eCollection 2017 Jul.

Abnormal brain metabolism on FDG-PET/CT is a common early finding in autoimmune encephalitis

Affiliations

Abnormal brain metabolism on FDG-PET/CT is a common early finding in autoimmune encephalitis

John C Probasco et al. Neurol Neuroimmunol Neuroinflamm. .

Abstract

Objective: To compare the rate of abnormal brain metabolism by FDG-PET/CT to other paraclinical findings and to describe brain metabolism patterns in autoimmune encephalitis (AE).

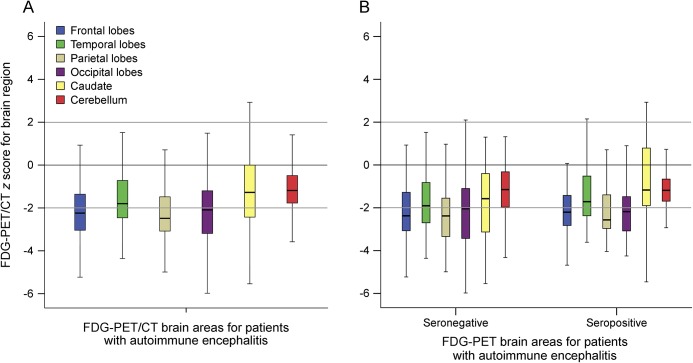
Methods: A retrospective review of clinical data and initial dedicated brain FDG-PET/CT studies for neurology inpatients with AE, per consensus criteria, treated at a single tertiary center over 123 months. Z-score maps of FDG-PET/CT were made using 3-dimensional stereotactic surface projections with comparison to age group-matched controls. Brain region mean Z-scores with magnitudes ≥2.00 were interpreted as significant. Comparisons were made to rates of abnormal initial brain MRI, abnormal initial EEG, and presence of intrathecal inflammation.

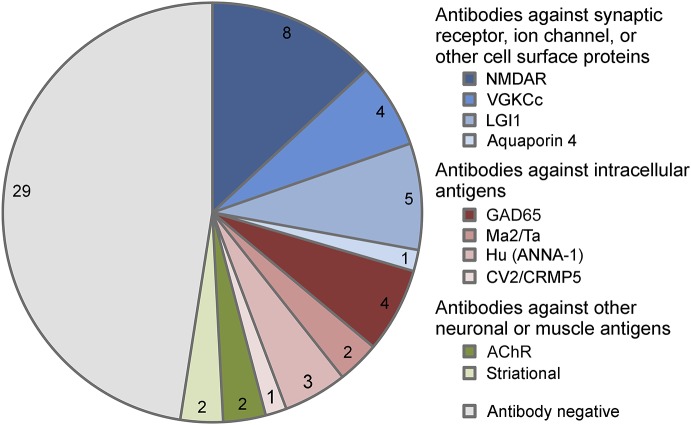
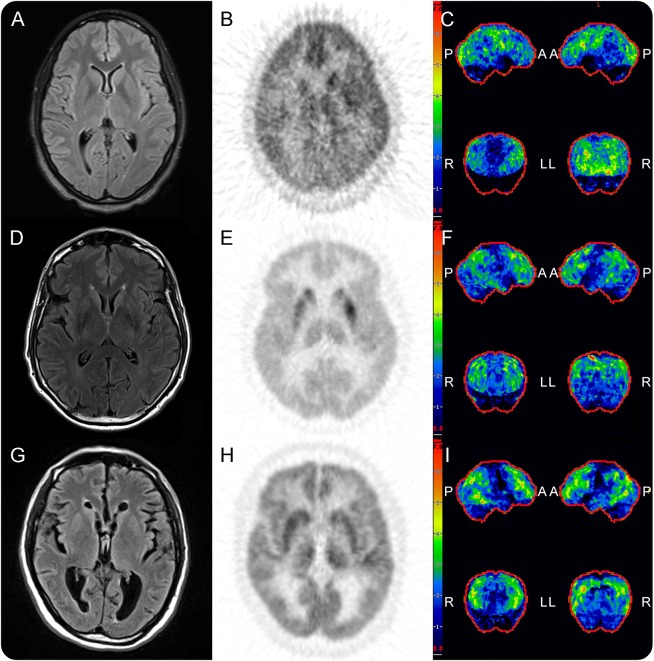
Results: Sixty-one patients with AE (32 seropositive) underwent brain FDG-PET/CT at median 4 weeks of symptoms (interquartile range [IQR] 9 weeks) and median 4 days from MRI (IQR 8.5 days). FDG-PET/CT was abnormal in 52 (85%) patients, with 42 (69%) demonstrating only hypometabolism. Isolated hypermetabolism was demonstrated in 2 (3%) patients. Both hypermetabolic and hypometabolic brain regions were noted in 8 (13%) patients. Nine (15%) patients had normal FDG-PET/CT studies. CSF inflammation was evident in 34/55 (62%) patients, whereas initial EEG (17/56, 30%) and MRI (23/57, 40%) were abnormal in fewer. Detection of 2 or more of these paraclinical findings was in weak agreement with abnormal brain FDG-PET/CT (κ = 0.16, p = 0.02).

Conclusions: FDG-PET/CT was more often abnormal than initial EEG, MRI, and CSF studies in neurology inpatients with AE, with brain region hypometabolism the most frequently observed.


Figures

Figure 1
Figure 1. Antibody status of patients with AE
Antibody status of patients with AE who underwent dedicated brain FDG-PET/CT (N = 61). AE = autoimmune encephalitis; ANNA-1 = anti–neuronal nuclear antibody 1; CRMP5 = collapsin response mediator protein 5; GAD65 = 65 kDa glutamic acid decarboxylase enzyme; VGKCc = voltage-gated potassium channel-complex antibodies different from leucine-rich inactivated 1 protein (LGI1) and contactin-associated protein-2 (CASPR2); AChR = acetylcholine receptor antibody.
Figure 2
Figure 2. Metabolism across brain regions in AE
Boxplots of Z-scores for FDG-avidity for brain areas on dedicated FDG-PET/CT for (A) patients meeting consensus criteria for AE, (B) seronegative and seropositive patients meeting the consensus criteria for AE. Z-scores varied across brain regions for patients with AE (p < 0.005), with values for the caudate being greater than those for frontal (p < 0.005), temporal (p = 0.002), parietal (p < 0.005), and occipital (p < 0.005) lobes. No difference was noted between seronegative and seropositive patient groups (p = 0.08). AE = autoimmune encephalitis.
Figure 3
Figure 3. Brain MRI, brain FDG-PET/CT and hypometabolic 3D-SSP maps for 3 patients with AE
Brain MRI, brain FDG-PET/CT, and hypometabolic 3D-SSP maps, respectively, for patients with anti-NMDAR encephalitis (A–C), anti-LGI1 encephalitis (D–F), and seronegative AE (G–I). For the anti-NMDAR encephalitis patient, note normal T2/FLAIR MRI (A) with right basal ganglia, right frontotemporoparietal, left frontal, and bilateral posterior cortical hypometabolism centered on the middle occipital lobe on FDG-PET/CT and 3D-SSP maps (B and C). For the anti-LGI1 patient, note normal T2/FLAIR MRI (D) with relatively normal basal ganglia metabolism (E) in setting of diffuse frontotemporoparietal hypometabolism on FDG-PET/CT and 3D-SSP maps (E and F). For the seronegative AE patient, again note normal T2/FLAIR MRI (G) with diffuse frontotemporoparietal hypometabolism on FDG-PET/CT and 3D-SSP maps (H and I). A = anterior; AE = autoimmune encephalitis; L = left; LGI1 = leucine-rich inactivated 1 protein; NMDAR = NMDA receptor; P = posterior; R = right; and 3D-SSP, 3-dimensional stereotactic surface projection.

References

    1. Graus F, Titulaer MJ, Balu R, et al. . A clinical approach to diagnosis of autoimmune encephalitis. Lancet Neurol 2016;15:391–404. - PMC - PubMed
    1. Ances BM, Vitaliani R, Taylor RA, et al. . Treatment-responsive limbic encephalitis identified by neuropil antibodies: MRI and PET correlates. Brain 2005;128:1764–1777. - PMC - PubMed
    1. Fisher RE, Patel NR, Lai EC, Schulz PE. Two different 18F-FDG brain PET metabolic patterns in autoimmune limbic encephalitis. Clin Nucl Med 2012;37:e213–e218. - PubMed
    1. Baumgartner A, Rauer S, Mader I, Meyer PT. Cerebral FDG-PET and MRI findings in autoimmune limbic encephalitis: correlation with autoantibody types. J Neurol 2013;260:2744–2753. - PubMed
    1. Masangkay N, Basu S, Moghbel M, Kwee T, Alavi A. Brain 18F-FDG-PET characteristics in patients with paraneoplastic neurological syndrome and its correlation with clinical and MRI findings. Nucl Med Commun 2014;35:1038–1046. - PubMed

LinkOut - more resources