. 2017 Sep;60(9):1751-1760.
doi: 10.1007/s00125-017-4307-2. Epub 2017 May 31.

Age-dependent insulin resistance in male mice with null deletion of the carcinoembryonic antigen-related cell adhesion molecule 2 gene

Affiliations

Age-dependent insulin resistance in male mice with null deletion of the carcinoembryonic antigen-related cell adhesion molecule 2 gene

Simona S Ghanem et al. Diabetologia. 2017 Sep.

Abstract

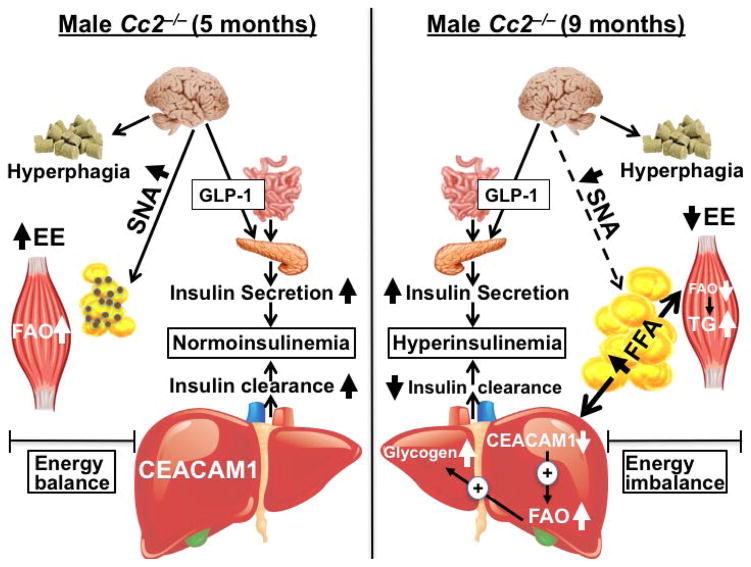
Aims/hypothesis: Cc2 -/- mice lacking the gene encoding the carcinoembryonic-antigen-related cell adhesion molecule 2 (Cc2 [also known as Ceacam2]) exhibit hyperphagia that leads to obesity and insulin resistance. This starts at 2 months of age in female mice. Male mutants maintain normal body weight and insulin sensitivity until the last age previously examined (7-8 months), owing to increased sympathetic tone to white adipose tissue and energy expenditure. The current study investigates whether insulin resistance develops in mutant male mice at a later age and whether this is accompanied by changes in insulin homeostasis.

Methods: Insulin response was assessed by insulin and glucose tolerance tests. Energy balance was analysed by indirect calorimetry.

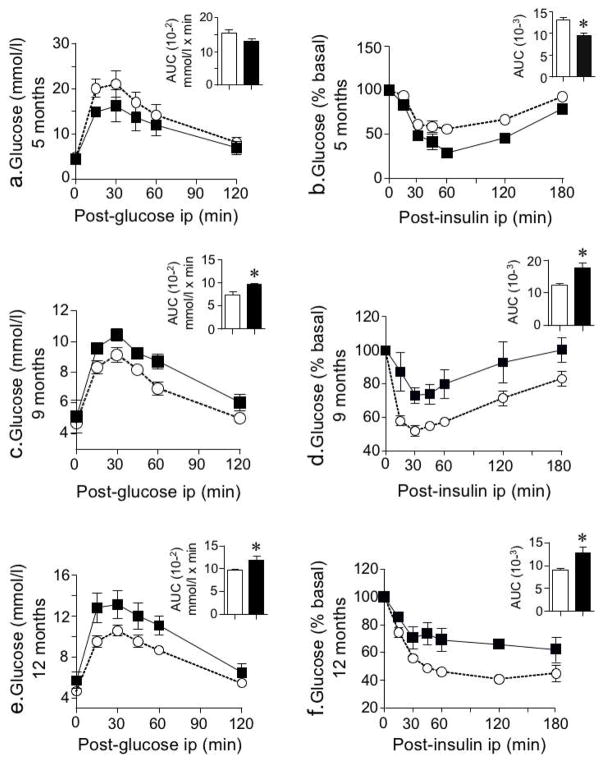
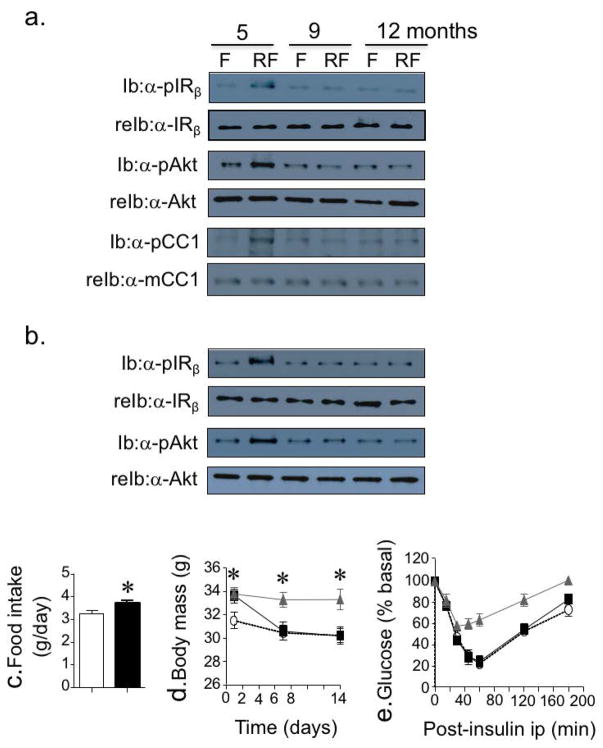
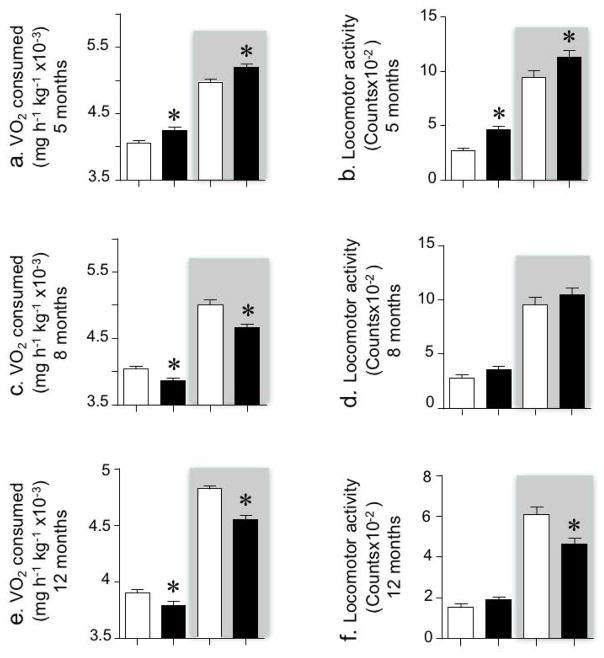
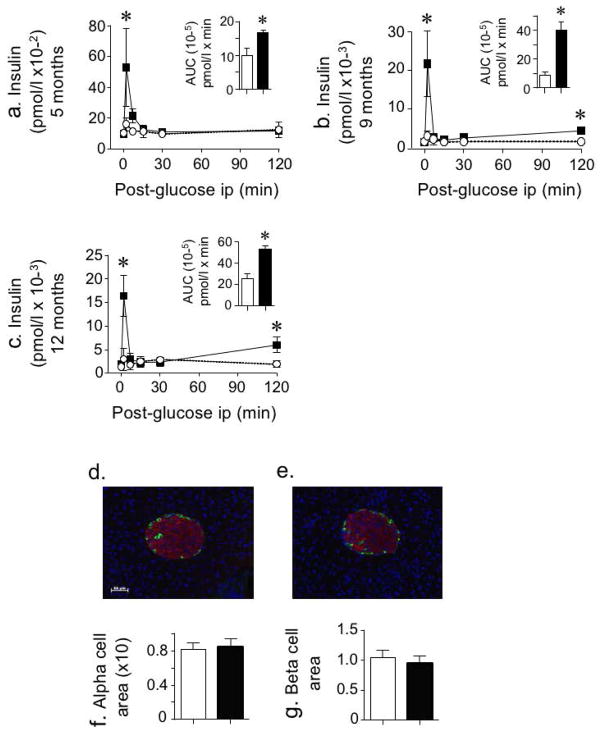
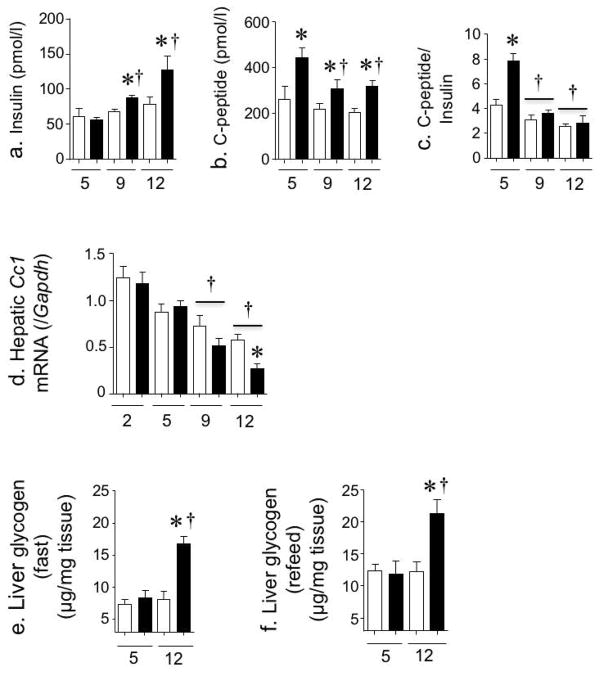
Results: Male Cc2 -/- mice developed overt metabolic abnormalities at about 9 months of age. These include elevated global fat mass, hyperinsulinaemia and insulin resistance (as determined by glucose and insulin intolerance, fed hyperglycaemia and decreased insulin signalling pathways). Pair-feeding experiments showed that insulin resistance resulted from hyperphagia. Indirect calorimetry demonstrated that older mutant male mice had compromised energy expenditure. Despite increased insulin secretion caused by Cc2 deletion, chronic hyperinsulinaemia did not develop in mutant male mice until about 9 months of age, at which point insulin clearance began to decline substantially. This was probably mediated by a marked decrease in hepatic CEACAM1 expression.

Conclusions/interpretation: The data demonstrate that at about 9 months of age, Cc2 -/- male mice develop a reduction in energy expenditure and energy imbalance which, combined with a progressive decrease in CEACAM1-dependent hepatic insulin clearance, causes chronic hyperinsulinaemia and sustained age-dependent insulin resistance. This represents a novel mechanistic underpinning of age-related impairment of hepatic insulin clearance.

Keywords: CEACAM2; Energy balance; Hyperinsulinaemia; Hyperphagia; Insulin clearance; Insulin resistance; Insulin secretion.


Conflict of interest statement

Duality of interest The authors declare that there is no duality of interest associated with this manuscript.

Figures

Fig. 1
Fig. 1
Intraperitoneal glucose and insulin tolerance tests. Male mice (5–12 months of age, n≥5 for each genotype and age group) were subjected to i.p. injections of glucose (1.5 g/kg body weight) (a, c, e) or insulin (0.75 U/kg body weight) (b, d, f) to assess blood glucose levels at 0–120 and 0–180 min post injection, respectively. AUC for the glucose (mmol/l × min) and insulin (arbitrary units) was measured and represented in bar graphs. Values are expressed as means ± SEM. *p<0.05 vs Cc2+/+ mice. Black, Cc2−/−; white, Cc2+/+
Fig. 2
Fig. 2
Insulin signalling and pair-feeding experiments. (a, b) Phosphorylation (and activation) of IRβ, Akt and CEACAM1 in response to insulin excursion during refeeding for 7 h following an overnight fast was assessed by immunoblotting proteins using antibodies to phosphorylated proteins (α-pIRβ, α-pAkt and α-pCEACAM1) in lysates from liver (a) and skeletal muscle (b) of Cc2−/− mutants at 5, 9 and 12 months of age. Re-immunoblotting with IRβ, Akt and CEACAM1 antibodies was performed to normalise the amount of loaded proteins. Each set is a representative of three independent experiments performed on different mice. (c) Daily food consumption over 5 consecutive days demonstrated hyperphagia in 9-month-old mutant mice (black bar) (n=5/genotype). (d, e). Pair-feeding experiments were performed on 9-month-old mice. (d) While some Cc2−/− mutants were fed ad libitum, some were subjected to a pair-feeding regimen for 2 weeks to decrease their body weight to the level of ad libitum-fed Cc2+/+ mice (n=5 for each genotype and feeding group). (e) At the end of the feeding period, insulin tolerance was determined. Values are expressed as means ± SEM at each time point. Black squares, pair-fed Cc2−/− mutants; grey triangles, Cc2−/− mutants fed ad libitum; white circles, Cc2+/+ mice fed ad libitum. *p<0.05 vs ad libitum-fed Cc2+/+. F, fasted; Ib, immunoblot; reIb, re-immunoblot; RF, refed
Fig. 3
Fig. 3
Indirect calorimetry analysis. Cc2+/+ and Cc2−/− mice (n=5/genotype) were individually caged, given free access to food and subjected to indirect calorimetry to analyse O2 (a, c, e), and spontaneous locomotor activity (b, d, f) over the 24 h period (starting at 06:00 hours). Graphs show average hourly data over each 12 h period of the light (06:00–18:00 hours) and dark (18:00–06:00 h) (shaded) cycles during the last 3 consecutive days. Values are expressed as means ± SEM. White, Cc2+/+; black, Cc2−/−. *p<0.05 vs Cc2+/+ mice
Fig. 4
Fig. 4
Insulin secretion and areas of islet cells. (ac) Glucose-mediated insulin levels were measured at 0–120 min post i.p. injection of age-matched 5-, 9- and 12-month-old mice (n≥5 for each genotype and age group). Values are expressed as means ± SEM. *p<0.05 in Cc2−/−vs Cc2+/+ mice. (dg) Pancreas sections from five of each of 12 month old Cc2+/+ (d) and Cc2−/− (e) mice were fixed and immunostained with antibodies against insulin (red) and glucagon (green) (scale bar at 50 μm). Areas of alpha (f) and beta cells (g) were estimated by morphometric analysis of islets from Cc2+/+ and Cc2−/− mice and calculated relative to pancreas area. Values, expressed as means ± SEM in arbitrary units, are presented in the bar graphs below. White, Cc2+/+ mice; black, Cc2−/−
Fig. 5
Fig. 5
Hepatic insulin clearance and glycogen content. (ac) Cc2−/− and Cc2+/+ mice were fasted overnight until 11:00 hours on the next day to determine steady-state plasma insulin (a) and C-peptide (b) levels in triplicate and calculate the C-peptide/insulin molar ratio (c) as a surrogate measure of insulin clearance (n≥6 mice for each genotype and age group). (d) Cc1 mRNA content was analysed in triplicate in liver tissues from mice aged 2–12 months (n≥5 for each genotype and age group). (e, f) Hepatic glycogen content was assayed in triplicate in overnight-fasted (e) and refed (f) mice (n≥5 mice for each subgroup). Values are expressed as means ± SEM. White, Cc2+/+; black, Cc2−/−. *p<0.05 vs Cc2+/+ of the same age group. p<0.05 vs mice at the earliest age examined
Fig. 6
Fig. 6
Metabolic regulation in 5 month old (left panel) and 9 month old (right panel) Cc2−/− male mice. Despite hyperphagia caused by Cc2 null deletion, younger Cc2−/− mice (left panel) manifest a hypermetabolic state that includes an increase in energy expenditure and fatty acid β-oxidation in skeletal muscle, increased brown adipogenesis of the white adipose depot (brown dots) and elevated sympathetic nervous system activation. Null deletion of Cc2 leads to an increase in insulin secretion mediated by GLP-1 release. This induces hepatic CEACAM1 expression to promote insulin clearance and maintain insulin at a physiological level to sustain insulin sensitivity. A metabolic switch occurs at an older age starting at ~9 months of age (right panel). This includes reduced brown adipogenesis and sympathetic tone to adipose tissue, which leads to visceral obesity and increased lipolysis and NEFA release. Excessive NEFA transport reduces fatty acid β-oxidation in skeletal muscle and consequently, increases triacylglycerol accumulation and insulin resistance in muscle. Additionally, NEFA transport to the liver reduces hepatic CEACAM1 levels, an event that provides a positive feedback mechanism on fatty acid β-oxidation. The resulting increase in citrate production and its redistribution to the cytoplasm lead to a rise in glucose 6-phosphate and its re-routing to the glycogen repletion pathways. Moreover, the decrease in CEACAM1 mediates a decrease in insulin clearance, which fails to counter the increase in insulin secretion, leading to chronic hyperinsulinaemia and sustained systemic insulin resistance. EE, energy expenditure; FAO, fatty acid β-oxidation; SNA, sympathetic nervous system activation

References

    1. Kuespert K, Pils S, Hauck CR. CEACAMs: their role in physiology and pathophysiology. Curr Opin Cell Biol. 2006;18:565–571. - PMC - PubMed
    1. Robitaille J, Izzi L, Daniels E, Zelus B, Holmes KV, Beauchemin N. Comparison of expression patterns and cell adhesion properties of the mouse biliary glycoproteins Bbgp1 and Bbgp2. Eur J Biochem. 1999;264:534–544. - PubMed
    1. Najjar SM. Regulation of insulin action by CEACAM1. Trends Endocrinol Metab. 2002;13:240–245. - PubMed
    1. Poy MN, Yang Y, Rezaei K, et al. CEACAM1 regulates insulin clearance in liver. Nat Genet. 2002;30:270–276. - PubMed
    1. DeAngelis AM, Heinrich G, Dai T, et al. Carcinoembryonic antigen-related cell adhesion molecule 1: a link between insulin and lipid metabolism. Diabetes. 2008;57:2296–2303. - PMC - PubMed

LinkOut - more resources