

Identification of candidate genes for fiber length quantitative trait loci through RNA-Seq and linkage and physical mapping in cotton
- PMID: 28569138
- PMCID: PMC5452627
- DOI: 10.1186/s12864-017-3812-5
Identification of candidate genes for fiber length quantitative trait loci through RNA-Seq and linkage and physical mapping in cotton
Abstract
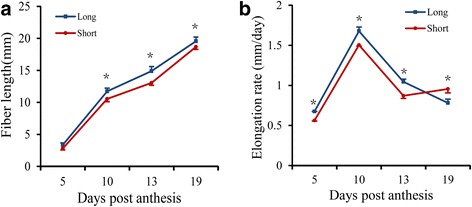
Background: Cotton (Gossypium spp.) fibers are single-celled elongated trichomes, the molecular aspects of genetic variation in fiber length (FL) among genotypes are currently unknown. In this study, two backcross inbred lines (BILs), i.e., NMGA-062 ("Long") and NMGA-105 ("Short") with 32.1 vs. 27.2 mm in FL, respectively, were chosen to perform RNA-Seq on developing fibers at 10 days post anthesis (DPA). The two BILs differed in 4 quantitative trait loci (QTL) for FL and were developed from backcrosses between G. hirsutum as the recurrent parent and G. barbadense.
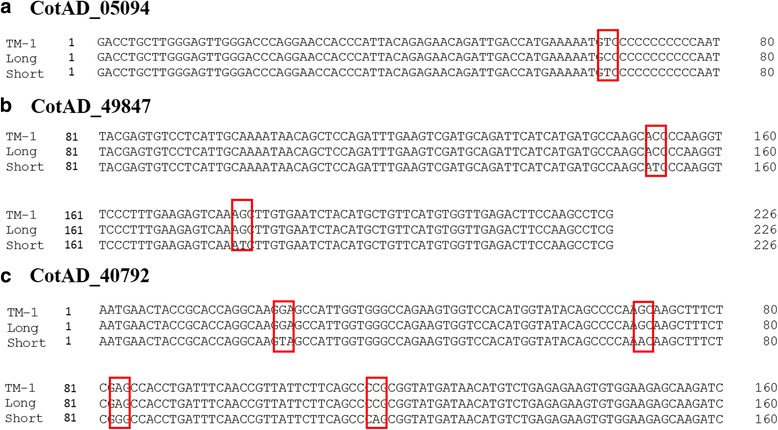
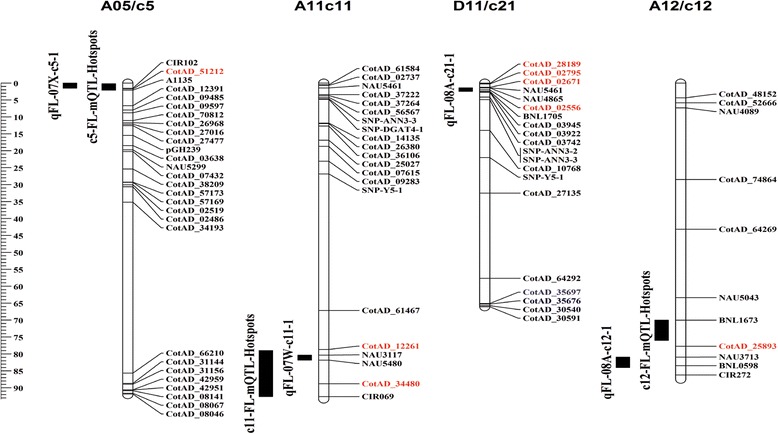
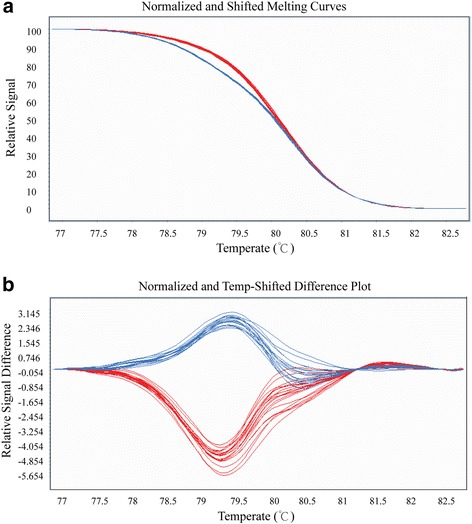
Results: In total, 51.7 and 54.3 million reads were obtained and assembled to 49,508 and 49,448 transcripts in the two genotypes, respectively. Of 1551 differentially expressed genes (DEGs) between the two BILs, 678 were up-regulated and 873 down-regulated in "Long"; and 703 SNPs were identified in 339 DEGs. Further physical mapping showed that 8 DEGs were co-localized with the 4 FL QTL identified in the BIL population containing the two BILs. Four SNP markers in 3 DEGs that showed significant correlations with FL were developed. Among the three candidate genes encoding for proline-rich protein, D-cysteine desulfhydrase, and thaumatin-like protein, a SNP of thaumatin-like protein gene showed consistent correlations with FL across all testing environments.
Conclusions: This study represents one of the first investigations of positional candidate gene approach of QTL in cotton in integrating transcriptome and SNP identification based on RNA-Seq with linkage and physical mapping of QTL and genes, which will facilitate eventual cloning and identification of genes responsible for FL QTL. The candidate genes may serve as the foundation for further in-depth studies of the molecular mechanism of natural variation in fiber elongation.
Keywords: Backcross inbred lines (BILs); Fiber elongation; G. barbadense; Gossypium hirsutum; Quantitative trait loci (QTL); RNA-Seq; Single nucleotide polymorphism (SNP).
Figures
References
-
- Basra AS, Malik C. Development of the cotton fiber. Int rev Cytol. 1984;89:65–113. doi: 10.1016/S0074-7696(08)61300-5. - DOI
Publication types
MeSH terms
Substances
LinkOut - more resources
Full Text Sources
Other Literature Sources
Miscellaneous
