. 2017 May 31;18(1):51.
doi: 10.1186/s12863-017-0512-8.

Genomic prediction in early selection stages using multi-year data in a hybrid rye breeding program

Affiliations

Genomic prediction in early selection stages using multi-year data in a hybrid rye breeding program

Angela-Maria Bernal-Vasquez et al. BMC Genet. .

Abstract

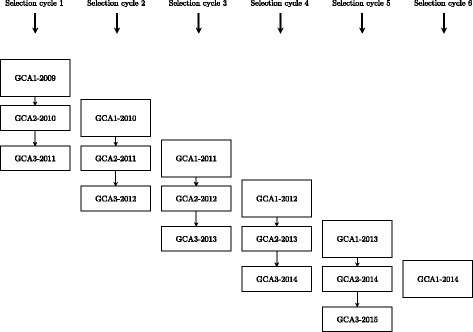
Background: The use of multiple genetic backgrounds across years is appealing for genomic prediction (GP) because past years' data provide valuable information on marker effects. Nonetheless, single-year GP models are less complex and computationally less demanding than multi-year GP models. In devising a suitable analysis strategy for multi-year data, we may exploit the fact that even if there is no replication of genotypes across years, there is plenty of replication at the level of marker loci. Our principal aim was to evaluate different GP approaches to simultaneously model genotype-by-year (GY) effects and breeding values using multi-year data in terms of predictive ability. The models were evaluated under different scenarios reflecting common practice in plant breeding programs, such as different degrees of relatedness between training and validation sets, and using a selected fraction of genotypes in the training set. We used empirical grain yield data of a rye hybrid breeding program. A detailed description of the prediction approaches highlighting the use of kinship for modeling GY is presented.

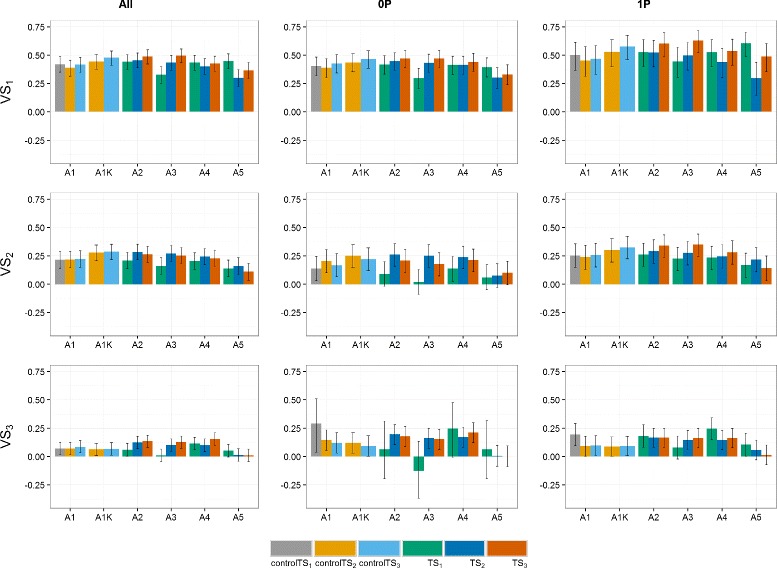
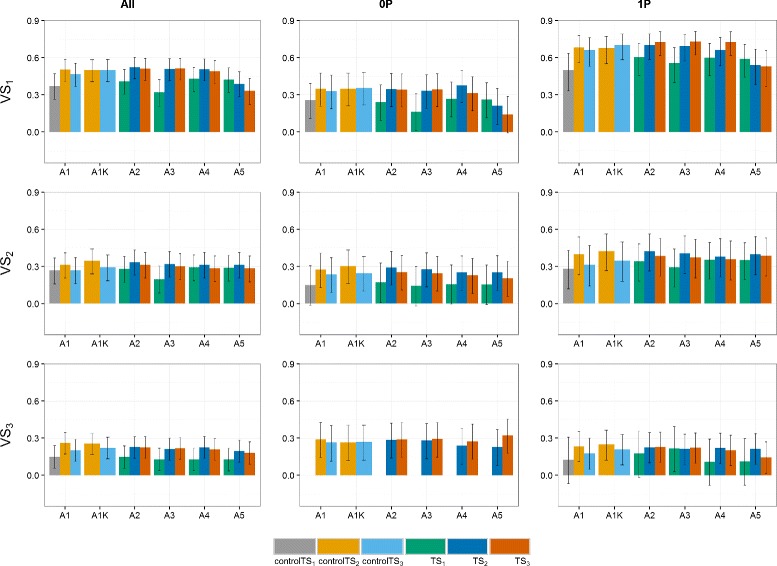
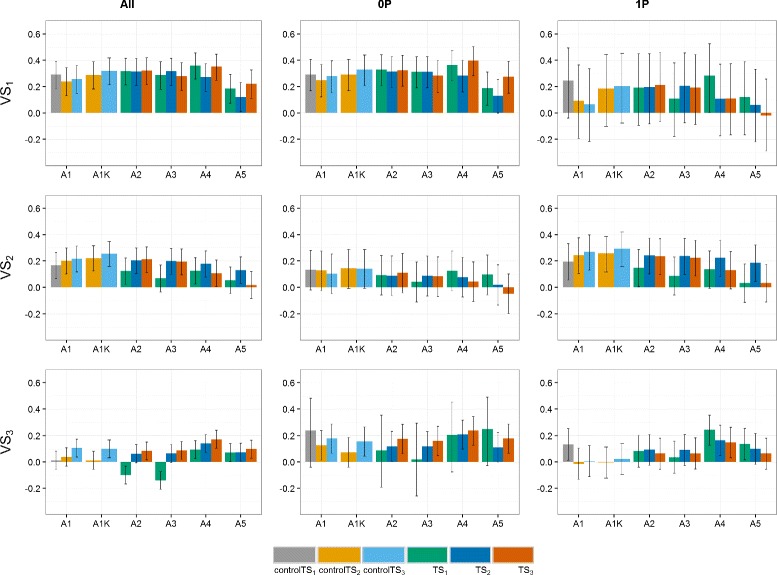
Results: Using the kinship to model GY was advantageous in particular for datasets disconnected across years. On average, predictive abilities were 5% higher for models using kinship to model GY over models without kinship. We confirmed that using data from multiple selection stages provides valuable GY information and helps increasing predictive ability. This increase is on average 30% higher when the predicted genotypes are closely related with the genotypes in the training set. A selection of top-yielding genotypes together with the use of kinship to model GY improves the predictive ability in datasets composed of single years of several selection cycles.

Conclusions: Our results clearly demonstrate that the use of multi-year data and appropriate modeling is beneficial for GP because it allows dissecting GY effects from genomic estimated breeding values. The model choice, as well as ensuring that the predicted candidates are sufficiently related to the genotypes in the training set, are crucial.

Keywords: Genomic prediction; Genotype-by-year interaction; Hybrid rye breeding; Multi-year data.


Figures

Fig. 1
Fig. 1
Selection cycles structure in the rye hybrid breeding program
Fig. 2
Fig. 2
Predictive abilities (y-axis) of the German and Polish dataset for the three scenarios. TS1 and controlTS1, TS2 and controlTS2, and TS3 and controlTS3 to predict the validation sets VS1, VS2 and VS3 with All, 0P and 1P-scenarios. Black lines for each bar represent the 95% confidence intervals of the predictive ability. Year-wise approach (A1) and year-wise with kinship approach (A1K) were fitted to the control sets, approaches 2-stg-Kin (A2), 2-stg-Kin-het (A3), 3-stg-NoKin (A4) and 3-stg-Kin (A5) to the complete sets. TS1: GCA1-2009 + GCA2-2010 + GCA3-2011, controlTS1: GCA1-2009, TS2: GCA1-2009 + GCA2-2010 + GCA1-2010 + GCA2-2011, controlTS2: GCA1-2009 + GCA1-2010, TS3: GCA1-2009 + GCA2-2010 + GCA3-2011 + GCA1-2010 + GCA2-2011 + GCA3-2012 + GCA1-2011 + GCA2-2012 + GCA3-2013, controlTS3: GCA1-2009 + GCA1-2010 + GCA1-2011, VS1: GCA1-2012, VS2: GCA1-2013, VS3: GCA1-2014
Fig. 3
Fig. 3
Predictive abilities (y-axis) of the German dataset for the three scenarios. TS1 and controlTS1, TS2 and controlTS2, and TS3 and controlTS3 to predict the validation sets VS1, VS2 and VS3 with All-, 0P- and 1P-scenarios. Black lines for each bar represent the 95% confidence intervals of the predictive ability. Year-wise approach (A1) and year-wise with kinship approach (A1K) were fitted to the control sets, approaches 2-stg-Kin (A2), 2-stg-Kin-het (A3), 3-stg-NoKin (A4) and 3-stg-Kin (A5) to the complete sets. TS1: GCA1-2009 + GCA2-2010 + GCA3-2011, controlTS1: GCA1-2009, TS2: GCA1-2009 + GCA2-2010 + GCA1-2010 + GCA2-2011, controlTS2: GCA1-2009 + GCA1-2010, TS3: GCA1-2009 + GCA2-2010 + GCA3-2011 + GCA1-2010 + GCA2-2011 + GCA3-2012 + GCA1-2011 + GCA2-2012 + GCA3-2013, controlTS3: GCA1-2009 + GCA1-2010 + GCA1-2011, VS1: GCA1-2012, VS2: GCA1-2013, VS3: GCA1-2014
Fig. 4
Fig. 4
Predictive abilities (y-axis) of the Polish dataset for the three scenarios. TS1 and controlTS1, TS2 and controlTS2, and TS3 and controlTS3 to predict the validation sets VS1, VS2 and VS3 with All-, 0P- and 1P-scenarios. Black lines for each bar represent the 95% confidence intervals of the predictive ability. Year-wise approach (A1) and year-wise with kinship approach (A1K) were fitted to the control sets, approaches 2-stg-Kin (A2), 2-stg-Kin-het (A3), 3-stg-NoKin (A4) and 3-stg-Kin (A5) to the complete sets. TS1: GCA1-2009 + GCA2-2010 + GCA3-2011, controlTS1: GCA1-2009, TS2: GCA1-2009 + GCA2-2010 + GCA1-2010 + GCA2-2011, controlTS2: GCA1-2009 + GCA1-2010, TS3: GCA1-2009 + GCA2-2010 + GCA3-2011 + GCA1-2010 + GCA2-2011 + GCA3-2012 + GCA1-2011 + GCA2-2012 + GCA3-2013, controlTS3: GCA1-2009 + GCA1-2010 + GCA1-2011, VS1: GCA1-2012, VS2: GCA1-2013, VS3: GCA1-2014
Fig. 5
Fig. 5
Principal component (PC) plots for the training datasets TS1, TS2 and TS3 of the German (GER) and the Polish (PL) programs. TS1: GCA1-2009 + GCA2-2010 + GCA3-2011, TS2: GCA1-2009 + GCA2-2010 + GCA1-2010 + GCA2-2011, TS3: GCA1-2009 + GCA2-2010 + GCA3-2011 + GCA1-2010 + GCA2-2011 + GCA3-2012 + GCA1-2011 + GCA2-2012 + GCA3-2013
Fig. 6
Fig. 6
Predictive abilities (y-axis) of the German and Polish dataset for selection scenarios of top-yield performance. Selection in the training set (TS): 50% of highest yielding genotypes (gray bars), 75% of highest yielding genotypes (yellow bars) and 100% of the genotypes (blue bars), using validation sets VS1, VS2 and VS3. Black lines for each bar represent the 95% confidence intervals of the predictive ability. Year-wise approach (A1) and year-wise with kinship approach (A1K) were fitted to the control TS, approaches 2-stg-Kin (A2), 2-stg-Kin-het (A3), 3-stg-NoKin (A4) and 3-stg-Kin (A5) to the complete TS. TS1: GCA1-2009 + GCA2-2010 + GCA3-2011, controlTS1: GCA1-2009, TS2: GCA1-2009 + GCA2-2010 + GCA1-2010 + GCA2-2011, controlTS2: GCA1-2009 + GCA1-2010, TS3: GCA1-2009 + GCA2-2010 + GCA3-2011 + GCA1-2010 + GCA2-2011 + GCA3-2012 + GCA1-2011 + GCA2-2012 + GCA3-2013, controlTS3: GCA1-2009 + GCA1-2010 + GCA1-2011, VS1: GCA1-2012, VS2: GCA1-2013, VS3: GCA1-2014
Fig. 7
Fig. 7
Predictive abilities (y-axis) of the German dataset for selection scenarios of top-yield performance. Selection in the training set (TS): 50% of highest yielding genotypes (gray bars), 75% of highest yielding genotypes (yellow bars) and 100% of the genotypes (blue bars), using validation sets VS1, VS2 and VS3. Black lines for each bar represent the 95% confidence intervals of the predictive ability. Year-wise approach (A1) and year-wise with kinship approach (A1K) were fitted to the control TS, approaches 2-stg-Kin (A2), 2-stg-Kin-het (A3), 3-stg-NoKin (A4) and 3-stg-Kin (A5) to the complete TS. TS1: GCA1-2009 + GCA2-2010 + GCA3-2011, controlTS1: GCA1-2009, TS2: GCA1-2009 + GCA2-2010 + GCA1-2010 + GCA2-2011, controlTS2: GCA1-2009 + GCA1-2010, TS3: GCA1-2009 + GCA2-2010 + GCA3-2011 + GCA1-2010 + GCA2-2011 + GCA3-2012 + GCA1-2011 + GCA2-2012 + GCA3-2013, controlTS3: GCA1-2009 + GCA1-2010 + GCA1-2011, VS1: GCA1-2012, VS2: GCA1-2013, VS3: GCA1-2014
Fig. 8
Fig. 8
Predictive abilities (y-axis) of the Polish dataset for selection scenarios of top-yield performance. Selection in the training set (TS): 50% of highest yielding genotypes (gray bars), 75% of highest yielding genotypes (yellow bars) and 100% of the genotypes (blue bars), using validation sets VS1, VS2 and VS3. Black lines for each bar represent the 95% confidence intervals of the predictive ability. Year-wise approach (A1) and year-wise with kinship approach (A1K) were fitted to the control TS, approaches 2-stg-Kin (A2), 2-stg-Kin-het (A3), 3-stg-NoKin (A4) and 3-stg-Kin (A5) to the complete TS. TS1: GCA1-2009 + GCA2-2010 + GCA3-2011, controlTS1: GCA1-2009, TS2: GCA1-2009 + GCA2-2010 + GCA1-2010 + GCA2-2011, controlTS2: GCA1-2009 + GCA1-2010, TS3: GCA1-2009 + GCA2-2010 + GCA3-2011 + GCA1-2010 + GCA2-2011 + GCA3-2012 + GCA1-2011 + GCA2-2012 + GCA3-2013, controlTS3: GCA1-2009 + GCA1-2010 + GCA1-2011, VS1: GCA1-2012, VS2: GCA1-2013, VS3: GCA1-2014

References

    1. Meuwissen TH, Hayes BJ, Goddard ME. Prediction of total genetic value using genome-wide dense marker maps. Genetics. 2001;157:1819–29. - PMC - PubMed
    1. Rutkoski J, Singh RP, Huerta-Espino J, Bhavani S, Poland J, Jannink JL, Sorrells ME. Efficient use of historical data for genomic selection: A case study of stem rust resistance in wheat. Plant Genome. 2015;8(1). - PubMed
    1. Schulz-Streeck T, Ogutu JO, Karaman Z, Knaak C, Piepho HP. Genomic selection using multiple populations. Crop Sci. 2012;52:2453–61. doi: 10.2135/cropsci2012.03.0160. - DOI
    1. Auinger HJ, Schönleben M, Lehermeier C, Schmidt M, Korzun V, Geiger HH, Piepho HP, Gordillo A, Wilde P, Bauer E, Schön CC. Model training across multiple breeding cycles significantly improves genomic prediction accuracy in rye (Secale cereale L) Theor Appl Genet. 2016;129:2043–53. doi: 10.1007/s00122-016-2756-5. - DOI - PMC - PubMed
    1. Schmidt M, Kollers S, Maasberg-Prelle A, Großer J, Schinkel B, Tomerius A, Graner A, Korzun V. Prediction of malting quality traits in barley based on genome-wide marker data to assess the potential of genomic selection. Theor Appl Genet. 2016;129:203–13. doi: 10.1007/s00122-015-2639-1. - DOI - PubMed

Publication types

LinkOut - more resources