. 2017 May 31;18(1):103.
doi: 10.1186/s13059-017-1226-y.

The developmental regulator PKL is required to maintain correct DNA methylation patterns at RNA-directed DNA methylation loci

Affiliations

The developmental regulator PKL is required to maintain correct DNA methylation patterns at RNA-directed DNA methylation loci

Rong Yang et al. Genome Biol. .

Abstract

Background: The chromodomain helicase DNA-binding family of ATP-dependent chromatin remodeling factors play essential roles during eukaryote growth and development. They are recruited by specific transcription factors and regulate the expression of developmentally important genes. Here, we describe an unexpected role in non-coding RNA-directed DNA methylation in Arabidopsis thaliana.

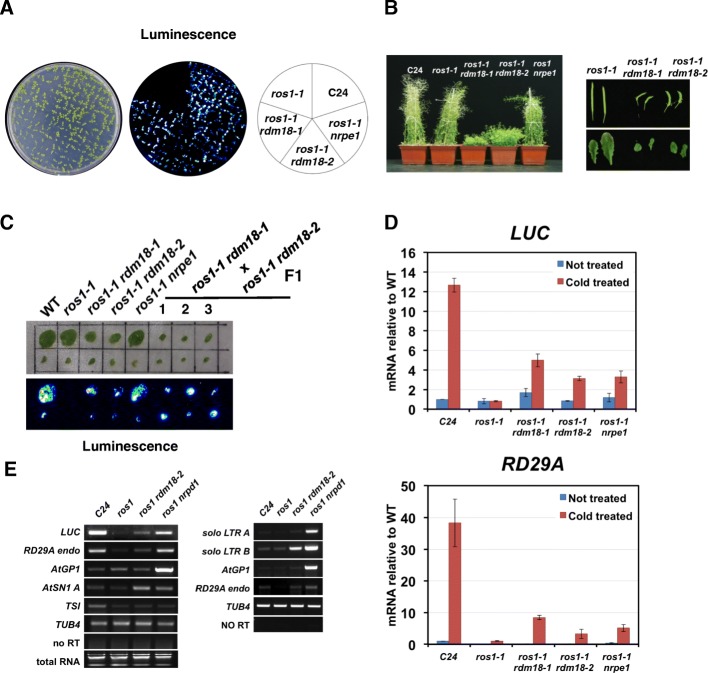
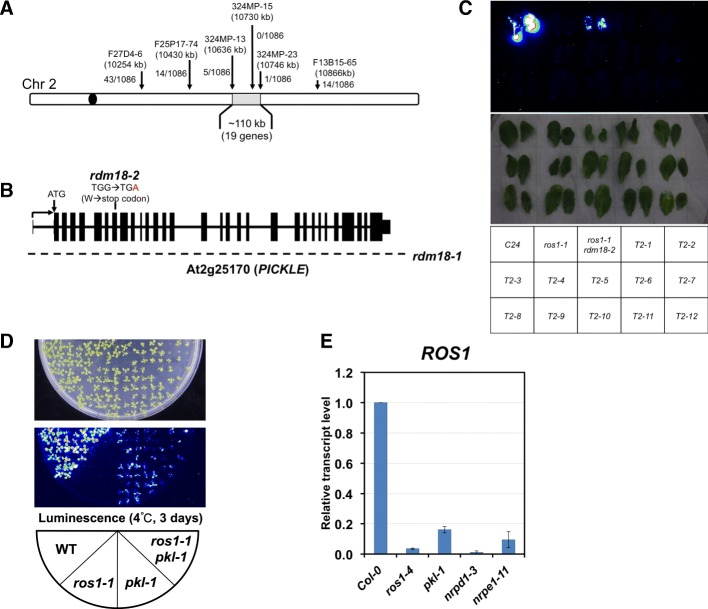
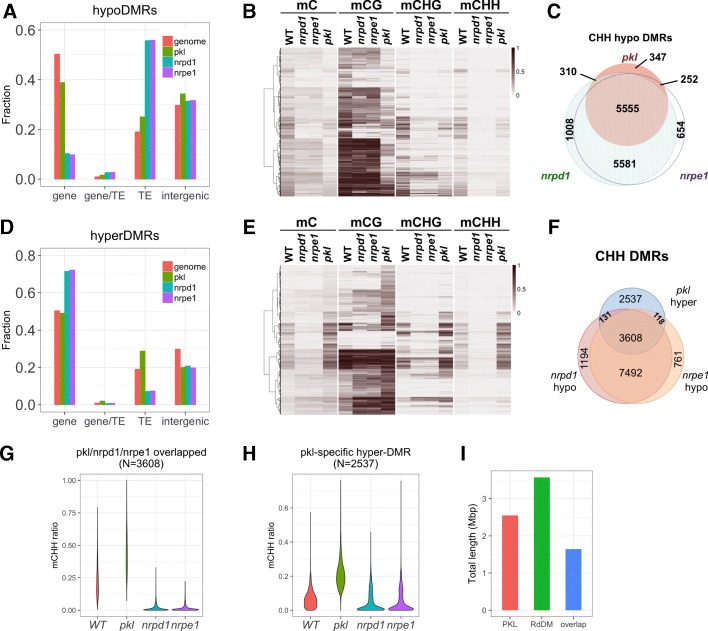
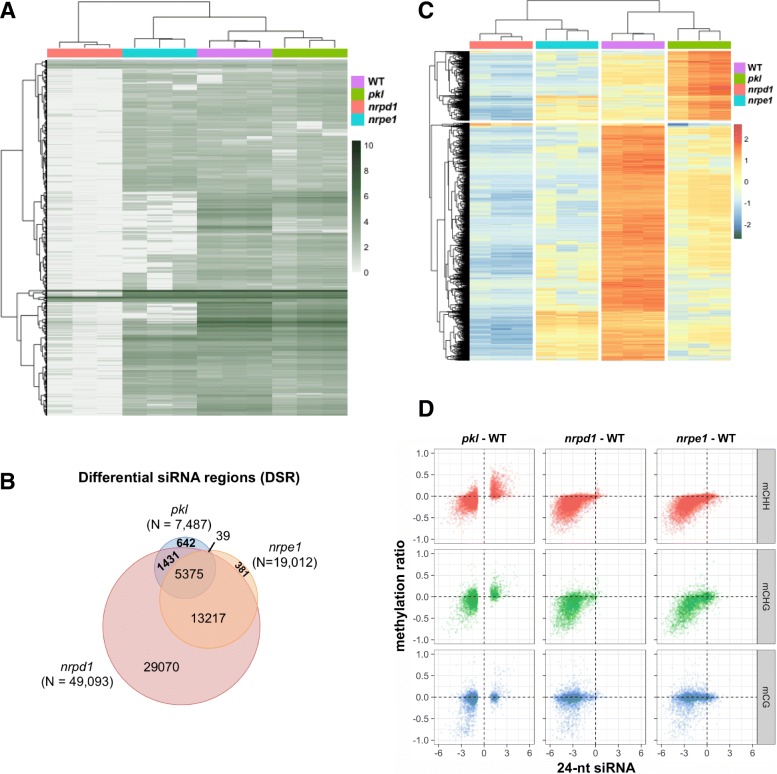
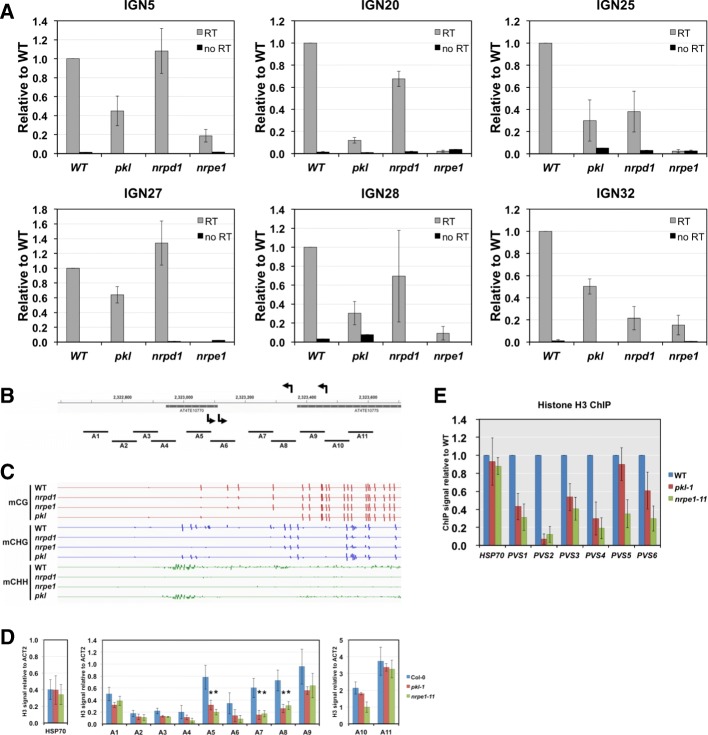
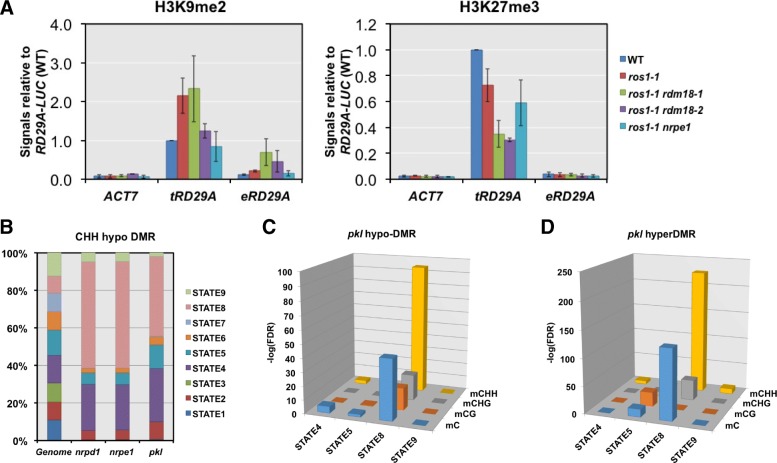
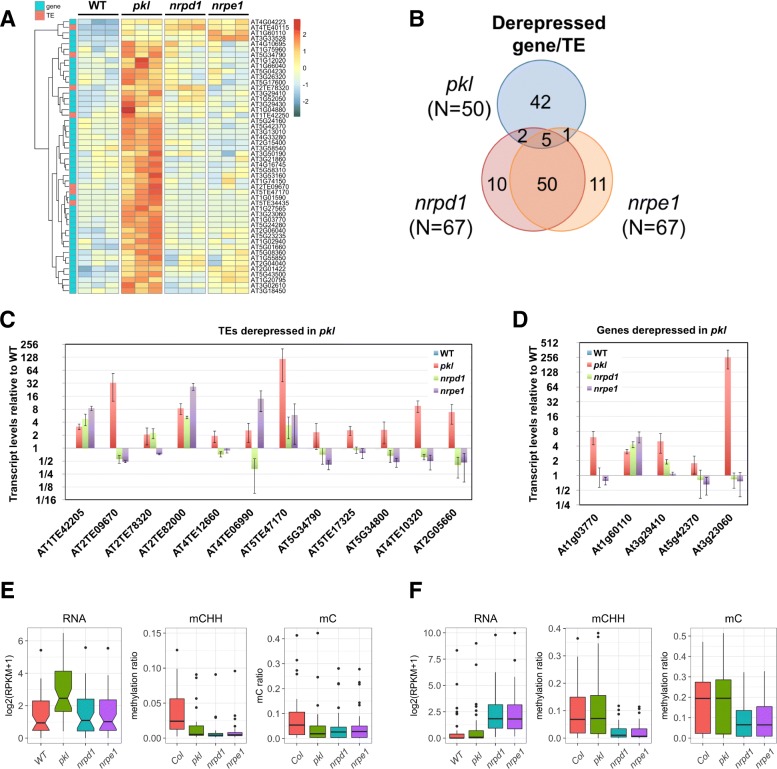
Results: Through forward genetic screens we identified PKL, a gene required for developmental regulation in plants, as a factor promoting transcriptional silencing at the transgenic RD29A promoter. Mutation of PKL results in DNA methylation changes at more than half of the loci that are targeted by RNA-directed DNA methylation (RdDM). A small number of transposable elements and genes had reduced DNA methylation correlated with derepression in the pkl mutant, though for the majority, decreases in DNA methylation are not sufficient to cause release of silencing. The changes in DNA methylation in the pkl mutant are positively correlated with changes in 24-nt siRNA levels. In addition, PKL is required for the accumulation of Pol V-dependent transcripts and for the positioning of Pol V-stabilized nucleosomes at several tested loci, indicating that RNA polymerase V-related functions are impaired in the pkl mutant.

Conclusions: PKL is required for transcriptional silencing and has significant effects on RdDM in plants. The changes in DNA methylation in the pkl mutant are correlated with changes in the non-coding RNAs produced by Pol IV and Pol V. We propose that at RdDM target regions, PKL may be required to create a chromatin environment that influences non-coding RNA production, DNA methylation, and transcriptional silencing.

Keywords: ATP-dependent chromatin remodeling; DNA methylation; Non-coding RNA (ncRNA); RNA-directed DNA methylation (RdDM).


Figures

Fig. 1
Fig. 1
RDM18 promotes transcriptional gene silencing at RdDM loci. a Bioluminescence phenotype of two-week-old ros1 rdm18 seedlings. b The ros1 rdm18 mutants exhibit multiple developmental defects. Shown in the figure includes dwarfism, short and curled siliques, and small leaves (eight-week-old plants). c Bioluminescence phenotype of F1 plants generated from crosses between ros1-1 rdm18-1 and ros1-1 rdm18-2. Cauline leaves from six-week-old plants were used for the analyses. d Transcript levels of the pRD29A-LUC transgene and endogenous RD29A gene examined by quantitative reverse transcription polymerase chain reaction (qRT-PCR). Relative transcript levels were shown with non-treated C24 set to one. Error bars indicate standard deviations calculated from three biological replicates. e Transcript levels of typical RdDM loci measured by RT-PCR. Two independent RT-PCR experiments were performed and the results are shown in two separate panels. LUC: transgene pRD29A-LUC, RD29A endo: endogenous RD29A gene. Ethidium bromide stained agarose gel (total RNA) and no reverse transcriptase PCR (no RT) serve as the loading control and the negative control respectively
Fig. 2
Fig. 2
Map-based cloning of the rdm18 mutations. a A diagram showing the mapped genomic region of rdm18-1. Genetic markers and their positioning on the chromosome are indicated on top of the arrow. b A diagram showing the gene structure of PKL and mutations identified in the rdm18 mutants. The dashed line indicates a whole gene deletion identified in the rdm18-1 mutant. c Bioluminescence phenotype of the T2 plants from the PKL-FLAG transformation of ros1-1 (–/–) rdm18-2 (+/–) plants. d The pkl-1 mutation released silencing at the RD29A promoter in the ros1-1 background. The F3 seedlings with indicated genotypes from pkl-1 (Col) x ros1-1 (C24) crosses were subjected to luminescence imaging after cold treatment for three days. e The transcript level of the ROS1 gene decreases in the pkl-1 mutant. Relative transcript level measured by real-time PCR is shown and the level in WT (Col-0) is arbitrarily set to 1. Error bars represent standard deviations calculated from three biological replicates
Fig. 3
Fig. 3
PKL affects DNA methylation levels at RdDM target loci. a Distribution of hypo differentially methylated regions (hypoDMRs) on genomic features. The Arabidopsis genome (TAIR10) was divided into four non-overlapping features based on the genome annotation. “gene/TE” represents genomics regions annotated as both genes and TEs. b Heatmap showing the DNA methylation levels at hypoDMRs identified in pkl. c Overlaps among CHH hypoDMRs identified in pkl, nrpd1, and nrpe1. The size of the circle is proportional to the number of DMRs identified in each mutant. d Distribution of hyperDMRs on the four non-overlapping genomic features. e Heatmap of the DNA methylation levels at hyperDMRs identified in pkl. f Overlaps among CHH hyperDMRs identified in pkl and CHH hypoDMRs identified in nrpd1 or nrpe1. g Violin plot showing the distribution of CHH methylation levels at the 3608 pkl hyperDMR regions that are also identified as hypoDMRs of nrpd1 and nrpe1 (Fig. 3f). h Violin plot showing the distribution of CHH methylation levels at the 2537 pkl-specific hyperDMR regions (Fig. 3f). i Total lengths of mCHH DMRs identified in the pkl mutant (PKL), the nrpd1 and nrpe1 mutants (RdDM), and the overlapped regions between the two
Fig. 4
Fig. 4
Effects of the pkl mutant on 24-nt siRNA abundance. a Heatmap showing the log(RPTM) value of 24-nt siRNAs in the genome. b Overlaps among differential siRNA regions (DSRs) identified in pkl, nrpd1 and nrpe1. Both upregulated and downregulated DSRs are included. c Heatmap showing the relative abundance of 24-nt siRNAs at DSRs identified in pkl. d The relationship between siRNA level changes and DNA methylation level changes at DSRs identified in pkl. The difference in log(RPTM) values between the indicated mutant and WT were plotted on the x-axis and the difference in DNA methylation values were plotted on the y-axis
Fig. 5
Fig. 5
PKL is required for RNA Pol V-dependent noncoding RNA accumulation and nucleosome occupancy. a Non-coding RNA levels at six IGN loci were examined by real-time PCR. No RT (reverse transcriptase) samples serve as controls for genomic DNA contamination. All the transcript levels are shown on a relative scale with the level in WT (Col-0) plants being set to one. Error bars represent standard deviations calculated from three biological replicates. b Diagram showing the IGN5 locus on chromosome 4. Arrows above and below the coordinates indicate the position and direction where Pol V-dependent transcripts start. Positions of amplicons used for assaying nucleosome density in (d) were indicated by black lines labeled as A1 through A11. c A screen shot of IGV (Integrative Genomics Viewer) showing DNA methylation levels at the IGN5 locus. The colored bars (red, blue, green) represent the methylation levels of specific cytosines on the DNA double strands on a scale from –1 to 1; minus values indicate the methylated cytosine is on the reverse strand. d Nucleosome densities at the IGN5 locus assayed by anti-histone H3 ChIP. Error bars indicate standard deviations calculated from three biological replicates. All the signals are normalized to the ACT2 + 1 nucleosome; stars indicate p < 0.05 between the mutant and WT (Col-0) based on two-tailed t-tests. e PKL affects the positioning of Pol V-stabilized nucleosomes (PVS). Nucleosome positioning was examined by histone H3 ChIP following micrococcal nuclease digestion of the chromatin. The +1 nucleosome at HSP70 served as a negative control. Error bars represent standard deviation calculated from three biological replicates
Fig. 7
Fig. 7
The correlation between PKL affected loci and repressive histone modifications. a H3K9me2 and H3K27me3 levels at the transgenic and endogenous RD29A (tRD29A and eRD29A) promoter measured by the chromatin immunoprecipitation (ChIP) assay. The ACT7 promoter (ACT7) serves as a negative control for the two repressive histone modifications. The ChIP DNA was quantified using real-time PCR and normalized to the signal at tRD29A in WT plants. Error bars represent standard deviations calculated from three biological replicates. b Distribution of nine different chromatin states on the whole genome or the CHH hypo-DMRs of the three mutants (nrpd1-3, nrpe1-11, and pkl-1). c, d Log transformed FDR values (–log10) of the overlap between hypoDMRs (c) and hyperDMRs (d) identified in pkl and the four repressive chromatin states
Fig. 6
Fig. 6
The effects of PKL on the silencing of genes and TEs. a Heatmap showing the relative transcript levels of the 50 derepressed genes/TEs in pkl that overlapped with hypo DMRs. b Overlaps among derepressed genes/TEs identified in pkl, nrpd1, and nrpe1 that overlapped with their respective hypo DMRs. c qRT-PCR verification of 12 upregulated transposable elements identified in pkl. d qRT-PCR verification of five upregulated genes identified in pkl. Transcript levels relative to WT were shown. Error bars represent standard deviations of three biological replicates. e Boxplots of the mRNA and DNA methylation levels of the 42 genes/TEs that are derepressed in pkl but not in RdDM mutants as shown in (b). f Boxplots of the mRNA and DNA methylation levels at the promoter region of the 50 genes/TEs that are derepressed in both nrpd1 and nrpe1 but not in pkl as shown in (b)

Similar articles

Cited by

References

    1. Law JA, Jacobsen SE. Establishing, maintaining and modifying DNA methylation patterns in plants and animals. Nat Rev Genet. 2010;11:204–20. doi: 10.1038/nrg2719. - DOI - PMC - PubMed
    1. Lister R, O’Malley RC, Tonti-Filippini J, Gregory BD, Berry CC, Millar AH, et al. Highly integrated single-base resolution maps of the epigenome in Arabidopsis. Cell. 2008;133:523–36. doi: 10.1016/j.cell.2008.03.029. - DOI - PMC - PubMed
    1. Cokus SJ, Feng S, Zhang X, Chen Z, Merriman B, Haudenschild CD, et al. Shotgun bisulphite sequencing of the Arabidopsis genome reveals DNA methylation patterning. Nature. 2008;452:215–9. doi: 10.1038/nature06745. - DOI - PMC - PubMed
    1. Feng S, Cokus SJ, Zhang X, Chen PY, Bostick M, Goll MG, et al. Conservation and divergence of methylation patterning in plants and animals. Proc Natl Acad Sci U S A. 2010;107:8689–94. doi: 10.1073/pnas.1002720107. - DOI - PMC - PubMed
    1. Woo HR, Dittmer TA, Richards EJ. Three SRA-domain methylcytosine-binding proteins cooperate to maintain global CpG methylation and epigenetic silencing in Arabidopsis. PLoS Genet. 2008;4:e1000156. doi: 10.1371/journal.pgen.1000156. - DOI - PMC - PubMed

Publication types

MeSH terms