. 2017 Aug 17;18(16):1604-1615.
doi: 10.1002/cbic.201700283. Epub 2017 Jul 10.

Probing Human Telomeric DNA and RNA Topology and Ligand Binding in a Cellular Model by Using Responsive Fluorescent Nucleoside Probes

Affiliations

Probing Human Telomeric DNA and RNA Topology and Ligand Binding in a Cellular Model by Using Responsive Fluorescent Nucleoside Probes

Sudeshna Manna et al. Chembiochem. .

Abstract

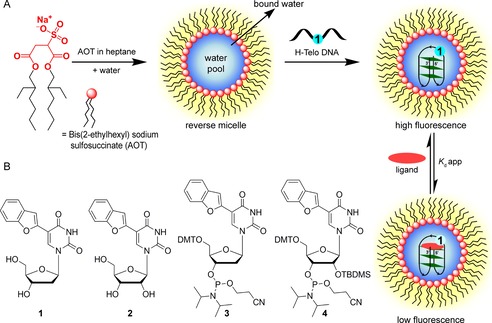
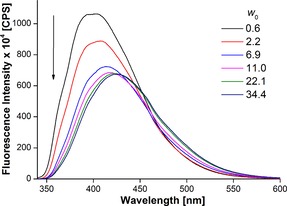
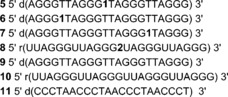
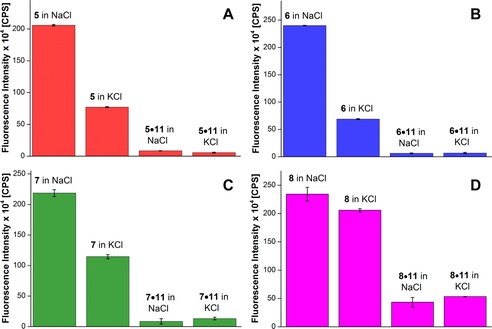
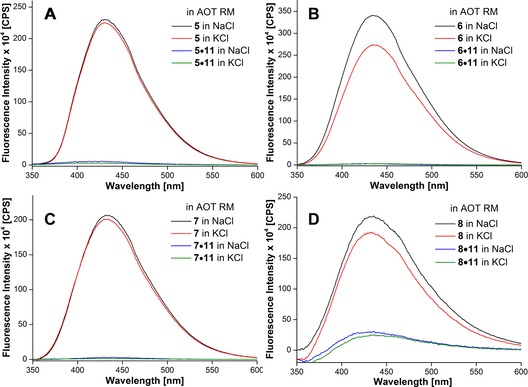
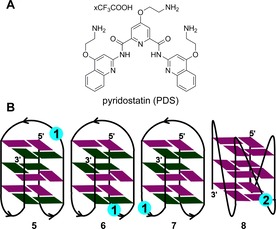
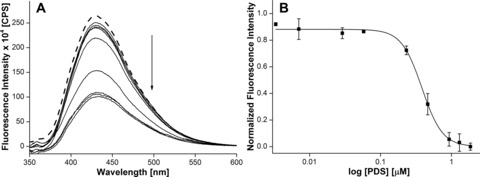
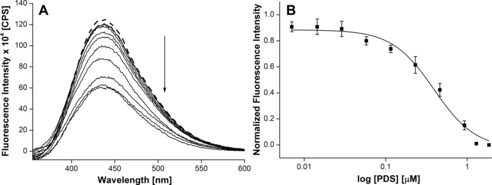
The development of biophysical systems that enable an understanding of the structure and ligand-binding properties of G-quadruplex (GQ)-forming nucleic acid sequences in cells or models that mimic the cellular environment would be highly beneficial in advancing GQ-directed therapeutic strategies. Herein, the establishment of a biophysical platform to investigate the structure and recognition properties of human telomeric (H-Telo) DNA and RNA repeats in a cell-like confined environment by using conformation-sensitive fluorescent nucleoside probes and a widely used cellular model, bis(2-ethylhexyl) sodium sulfosuccinate reverse micelles (RMs), is described. The 2'-deoxy and ribonucleoside probes, composed of a 5-benzofuran uracil base analogue, faithfully report the aqueous micellar core through changes in their fluorescence properties. The nucleoside probes incorporated into different loops of H-Telo DNA and RNA oligonucleotide repeats are minimally perturbing and photophysically signal the formation of respective GQ structures in both aqueous buffer and RMs. Furthermore, these sensors enable a direct comparison of the binding affinity of a ligand to H-Telo DNA and RNA GQ structures in the bulk and confined environment of RMs. These results demonstrate that this combination of a GQ nucleoside probe and easy-to-handle RMs could provide new opportunities to study and devise screening-compatible assays in a cell-like environment to discover GQ binders of clinical potential.

Keywords: G-quadruplexes; fluorescent probes; micelles; nucleosides; telomeric repeats.


Figures

Figure 1
Figure 1
A) A schematic illustration of the platform to study the structure and ligand‐binding ability of GQ‐forming ONs (e.g., H‐Telo DNA repeat) in a cell‐like confined environment by using 5‐benzofuran‐modified 2′‐deoxyuridine (1) and bis(2‐ethylhexyl) sodium sulfosuccinate (AOT) RMs. The water pool solubilizes the fluorescently labeled telomeric ON repeats and supports the formation of respective GQ structures. The nucleoside probes photophysically detect the formation of the GQ structure and also help in determining the binding affinity of a ligand to GQ structures in a confined environment. B) Chemical structures of fluorescent 2′‐deoxy (1) and ribonucleoside (2) analogues and phosphoramidite substrates 3 and 4 used in the synthesis of labeled H‐Telo DNA and RNA ONs, respectively. DMT=4,4′‐dimethoxytrityl, TBDMS=tert‐butyldimethylsilyl.
Figure 2
Figure 2
Emission spectra of 2 (1 μm) in AOT RMs (200 mm in n‐heptane) at different w 0 values. Samples were excited at λ=322 nm with excitation and emission slit widths of 3 and 4 nm, respectively.
Figure 3
Figure 3
Benzofuran‐modified H‐Telo DNA ONs 57: the dT residue in the first (6), second (5), and third (7) loops of H‐Telo DNA ONs was replaced with emissive nucleoside 1. Benzofuran‐modified TERRA ON 8: the rU residue in the second loop was replaced with emissive nucleoside 2. ONs 9 and 10 are control, unmodified H‐Telo DNA and TERRA, respectively. ON 11 is complementary to DNA ONs 57 and RNA ON 8.
Figure 4
Figure 4
Steady‐state fluorescence spectra of H‐Telo DNA ON A) 5 and corresponding duplex 5⋅11, B) 6 and corresponding duplex 6⋅11, C) 7 and corresponding duplex 7⋅11, and D) TERRA ON 8 and corresponding duplex 8⋅11 in TrisHCl buffer buffer (pH 7.5) containing 50 mm NaCl or 50 mm KCl. DNA ON samples (1 μm) were excited at λ=322 nm with excitation and emission slit widths of 3 and 4 nm, respectively. RNA ON samples (0.26 μm) were excited at λ=322 nm with excitation and emission slit widths of 6 and 8 nm, respectively.
Figure 5
Figure 5
Steady‐state fluorescence spectra of H‐Telo DNA ON A) 5 and corresponding duplex 5⋅11, B) 6 and corresponding duplex 6⋅11, C) 7 and corresponding duplex 7⋅11, and D) TERRA ON 8 and corresponding duplex 8⋅11 in AOT RMs (200 mm in n‐heptane) at w 0=20 containing 50 mm NaCl or 50 mm KCl. DNA ON samples (1 μm) were excited at λ=322 nm with excitation and emission slit widths of 3 and 4 nm, respectively. TERRA samples (0.26 μm) were excited at λ=322 nm with excitation and emission slit widths of 6 and 8 nm, respectively.
Figure 6
Figure 6
A) Chemical structure of the GQ binder, PDS, used herein. B) The position of nucleoside 1 in different loops of the antiparallel GQ structure of ONs 57 is shown. In ON 5, nucleoside 1 is placed in the diagonal loop. In ONs 6 and 7, nucleoside 1 is placed in the lateral loops. The position of ribonucleoside 2 in the propeller loop of the parallel GQ structure of RNA ON 8 is shown. The syn and anti guanosines are colored in green and purple, respectively.
Figure 7
Figure 7
Emission spectra of H‐Telo DNA ONs A) 5, B) 6, and C) 7 in aqueous buffer (pH 7.5) containing NaCl (50 mm) as a function of increasing concentration of PDS. The dashed line represents the fluorescence spectrum of GQ ONs in the absence of PDS. The ON (0.28 μm) samples were excited at λ=322 nm with excitation and emission slit widths of 4 and 6 nm, respectively. D) Curve fitting for the binding of PDS to H‐Telo DNA ONs 57 in aqueous buffer containing NaCl (50 mm). Normalized fluorescence intensity at the respective emission maximum (Table 2) is plotted against log [PDS].
Figure 8
Figure 8
A) Emission spectra of H‐Telo DNA ON 5 (0.28 μm) in AOT RMs containing NaCl (50 mm) as a function of increasing concentration of PDS. The dashed line represents the fluorescence spectrum of 5 in the absence of PDS. The samples were excited at λ=322 nm with excitation and emission slit widths of 4 and 6 nm, respectively. B) Curve fitting for the binding of PDS to H‐Telo DNA ON 5 in AOT RMs. Normalized fluorescence intensity at λ=430 nm is plotted against log [PDS].
Figure 9
Figure 9
A) Emission spectra of TERRA ON 8 (0.26 μm) in AOT RMs containing NaCl (50 mm) as a function of increasing concentration of PDS. The dashed line represents the fluorescence spectrum of 8 in the absence of PDS. The samples were excited at λ=322 nm with excitation and emission slit widths of 6 and 8 nm, respectively. B) Curve fitting for the binding of PDS to TERRA ON 8 in AOT RMs. Normalized fluorescence intensity at λ=435 nm is plotted against log [PDS].

Similar articles

Cited by

References

    1. None
    1. Meyne J., Ratliff R. L., Moyzis R. K., Proc. Natl. Acad. Sci. USA 1989, 86, 7049–7053; - PMC - PubMed
    1. Harris M. L., Merrick C. J., PLoS Pathog. 2015, 11, e1004562. - PMC - PubMed
    1. Huppert J. L., Balasubramanian S., Nucleic Acids Res. 2005, 33, 2908–2916. - PMC - PubMed
    1. Collie G. W., Parkinson G. N., Chem. Soc. Rev. 2011, 40, 5867–5892. - PubMed

Publication types

LinkOut - more resources