. 2017 Jun 1:8:15080.
doi: 10.1038/ncomms15080.

Tumour-associated macrophages secrete pleiotrophin to promote PTPRZ1 signalling in glioblastoma stem cells for tumour growth

Affiliations

Tumour-associated macrophages secrete pleiotrophin to promote PTPRZ1 signalling in glioblastoma stem cells for tumour growth

Yu Shi et al. Nat Commun. .

Abstract

Intense infiltration of tumour-associated macrophages (TAMs) facilitates malignant growth of glioblastoma (GBM), but the underlying mechanisms remain undefined. Herein, we report that TAMs secrete abundant pleiotrophin (PTN) to stimulate glioma stem cells (GSCs) through its receptor PTPRZ1 thus promoting GBM malignant growth through PTN-PTPRZ1 paracrine signalling. PTN expression correlates with infiltration of CD11b+/CD163+ TAMs and poor prognosis of GBM patients. Co-implantation of M2-like macrophages (MLCs) promoted GSC-driven tumour growth, but silencing PTN expression in MLCs mitigated their pro-tumorigenic activity. The PTN receptor PTPRZ1 is preferentially expressed in GSCs and also predicts GBM poor prognosis. Disrupting PTPRZ1 abrogated GSC maintenance and tumorigenic potential. Moreover, blocking the PTN-PTPRZ1 signalling by shRNA or anti-PTPRZ1 antibody potently suppressed GBM tumour growth and prolonged animal survival. Our study uncovered a critical molecular crosstalk between TAMs and GSCs through the PTN-PTPRZ1 paracrine signalling to support GBM malignant growth, indicating that targeting this signalling axis may have therapeutic potential.


Conflict of interest statement

The authors declare no competing financial interests.

Figures
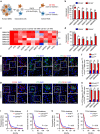
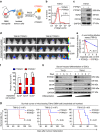
Figure 1
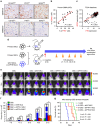
Figure 1. PTN is preferentially expressed in CD11b+/CD163+ M2 TAMs and informs poor prognosis of GBM patients.
(a) Schematic diagram of the isolation of CD11b+/CD163+ M2 TAMs and CD11b+/CD163 control TAMs from human GBMs using FACS. (b) qRT–PCR analyses of CD163 expression between FACS-sorted CD11b+/CD163+ M2 TAMs and CD11b+/CD163 control TAMs from six cases of human GBMs. Data are shown as means±s.e.m., n=3, **P<0.01, Student's t-test. (c) Expression heatmap of the upregulated genes in CD163+ M2 TAMs relative to CD163 control TAMs sorted from human GBMs. The top 10 of gene candidates identified from the microarray profiling (GEO, GSE37475) were validated in CD11b+/CD163+ M2 TAMs relative to the CD11b+/CD163 control TAMs using qRT–PCR analysis. CD163 was used as a positive control marker. Data are shown as a heatmap using Cluster/Java Treeview. Heatmap colour ranging from minimum (blue) to maximum (red) represents the relative gene expression of CD163+ M2 TAMs to the CD163 control TAMs.(d) qRT–PCR analyses of PTN expression between FACS-sorted CD11b+/CD163+ M2 TAMs and CD11b+/CD163 control TAMs from six cases of human GBMs. Data are shown as means±s.e.m., n=3, **P<0.01, Student's t-test. (e) Representative immunofluorescent staining of the TAM marker Iba1 (in red) and PTN (in green) in human GBM tissues. Areas indicated with squares are enlarged and shown on the right side of each image. Scale bar represents 25 μm. (f) Graphical analysis of e showing abundant PTN expression in the Iba1+ TAM-enriched regions in GBMs. PTN expression and Iba1+ TAM density were quantified by ImageJ software. Data are shown as means±s.d., n=5, **P<0.01, Student's t-test. (g,h) Immunofluorescence (g) and corresponding quantification data (h) showing abundant PTN expression in the CD163+ TAM-enriched regions in human GBMs. Scale bar represents 25 μm. Data are shown as means±s.d., n=5, **P<0.01, Student's t-test. (i,j) Kaplan–Meier survival analysis of CD163 expression and the progression-free survival (i) or overall survival (j) of GBM patients from the TCGA database. P<0.05 (i), P<0.01 (j), log-rank test. (k,l) Kaplan–Meier survival analysis of PTN expression and the progression-free survival (k) or overall survival (l) of GBM patients from the TCGA database. P<0.05, log-rank test. DAPI, 4,6-diamidino-2-phenylindole.
Figure 2
Figure 2. PTN is enriched with GSCs and mediates the pro-tumorigenic effect of M2 TAMs.
(a) IHC staining of M2 TAM marker CD163, PTN and the GSC marker SOX2 in human GBMs using serial sections. Scale bar represents 50 μm. (b,c) Correlation analysis of PTN and SOX2 expressions in GBM specimens from the Southwest hospital (b) and those from the TCGA database (c). P<0.001, Pearson's r test. (d) Schematic diagram of GSC-driven xenografts co-implanted with U937-derived MLCs expressing shPTN (shPTN MLCs) or shNT (shNT MLCs). After implantation, tumour growth was monitored through the IVIS bioluminescent imaging system and mice were killed when neurological signs occurred. (ef) The representative bioluminescent images (e) and the quantification (f) of the tumour-bearing mice implanted with GSCs only or co-implanted with GSCs and shPTN MLCs or shNT MLCs. Data are shown as means ±s.e.m., n=5, **P<0.01, NS, not significant, ANOVA test. (g) Kaplan–Meier survival curves of mice implanted with GSCs only or co-implanted with GSCs and shPTN MLCs or shNT MLCs. n=5, P<0.01, log-rank test. d, days.
Figure 3
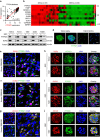
Figure 3. The PTN receptor PTPRZ1 is preferentially expressed by GSCs.
(a) Bivariate correlation analyses showing a positive correlation of PTN and PTPRZ1 expression in human GBMs from the TCGA database (https://tcga-data.nci.nih.gov/tcga). The expressions of PTN and PTPRZ1 in human GBMs were obtained from gene-profiling data from the TCGA database. n=541, P<0.001, Pearson's r test. (b) Expression heatmap of top 10 upregulated genes in GSC lines (n=27) relative to NSTC lines (n=36) from GEO profiles (GEO: GDS3885). Candidate genes enriched in GSCs were identified when the average gene expression ratio of GSCs/NSTCs was ≥3.0-fold. Heatmap was visualized using Cluster/Java Treeview. (c) Immunoblot analysis showing preferential expression of PTPRZ1 and the GSC marker SOX2 in GSCs relative to matched NSTCs derived from human GBMs. α-Tubulin was used for normalization. (d) Immunofluorescence of PTPRZ1 (in green) in GSCs or NSTCs from T0912 GBM. Scale bar represents 50 μm. (eg) Co-immunofluorescent staining of PTPRZ1 (in green) and the GSC marker SOX2 (in red, e), OLIG2 (in red, f) and CD133 (in red, g) in human GBMs. PTPRZ1 is preferentially expressed in GBM cells expressing GSC markers. Scale bar represents 25 μm. (hj) Co-immunofluorescent staining of PTPRZ1 (in green) and the GSC marker SOX2 (in red, h), OLIG2 (in red, i) or CD133 (in red, j) in GSC tumourspheres. Co-enrichment of PTPRZ1 with the GSC markers was observed in GSC tumourspheres. Scale bar represents 25 μm. DAPI, 4,6-diamidino-2-phenylindole.
Figure 4
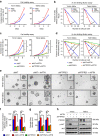
Figure 4. The PTN–PTPRZ1 signalling axis is critical for GSC maintenance.
(a,b) The cell viability assay (a) and in vitro limiting dilution assay (b) of GSCs treated with rhPTN showing that rhPTN facilitated GSC proliferation and self-renewal. Data are shown as means±s.d., n=5, **P<0.01, Student's t-test (a); n=10, *P<0.05, likelihood ratio test (b). (c,d) The cell viability assay (c) and in vitro limiting dilution assay (d) of GSCs expressing shPTPRZ1 or shNT in combination of rhPTN treatment. Disruption of PTPRZ1 compromised the promoting role of PTN on GSC proliferation (c) and self-renewal (d). Data are shown as means±s.d., n=5, **P<0.01, Student's t-test (c); n=10, *P<0.05, **P<0.01, likelihood ratio test (d). (eg) Tumoursphere formation assay of GSCs expressing shPTPRZ1 or shNT in combination with the treatment of rhPTN. The representative images of GSC tumourspheres (e) and the quantification of numbers (f) and diameter (g) of the GSC tumourspheres showing that silencing PTPRZ1 expression significantly compromises rhPTN-promoted GSC tumoursphere formation ability. Scale bar represents 100 μm. Data are shown as means±s.d., n=5, *P<0.05, **P<0.01, ANOVA test. (h) Immunoblot analyses of PTPRZ1, phospho-AKT (p-Ser473) and total AKT in GSCs expressing shPTPRZ1 or shNT in combination with rhPTN stimulation.
Figure 5
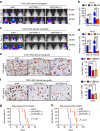
Figure 5. Disruption of PTPRZ1 potently inhibits GSC tumour growth and prolongs the animal survival.
(ad) The bioluminescent images (a,c) and quantification (b,d) of xenografts derived from T4121 GSCs (a,b) or T0912 GSCs (c,d) expressing shPTPRZ1 or shNT control. Data are shown as means±s.e.m., n=5, *P<0.05, **P<0.01, ANOVA test. (e,f) The representative IHC images (left panel) and the quantification (right panel) of Ki67 expression in xenografts derived from T4121 GSCs (e) or T0912 GSCs (f) expressing shPTPRZ1 or shNT control. Xenografts were collected at 28 days (T4121) or 56 days (T0912) after tumour implantation. Data are shown as means±s.d., n=5, **P<0.01, ANOVA test. Scale bar represents 25 μm. (g,h) Kaplan–Meier survival curves of mice implanted with T4121 GSCs (g) or T0912 GSCs (h) expressing shPTPRZ1 or shNT control. Disruption of PTPRZ1 significantly extends the survival of mice bearing GSC-derived xenografts. n=5, P<0.01, log-rank test.
Figure 6
Figure 6. GSCs are enriched in the glioma cells with high PTPRZ1 expression.
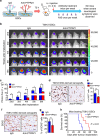
(a) Schematic diagram of the isolation of PTPRZ1+ and PTPRZ1 subpopulations from orthotopic GBM xenografts. (b) FACS sorting of PTPRZ1+ and PTPRZ1 subpopulations from T0912 GBM xenografts. Human GBM cells dissociated from xenografts were enriched and incubated with anti-human PTPRZ1 antibody or the isotype IgG followed by incubation of FITC-labelled secondary antibody to sort PTPRZ1+ and PTPRZ1 GBM cells. (c) Immunoblot analyses of the expressions of PTPRZ1 and GSC markers (SOX2 and CD133) in FACS-sorted PTPRZ1+ and PTPRZ1 glioma cells. (d) Representative bioluminescent images of intracranial GBM xenografts derived from FACS-sorted PTPRZ1+ and PTPRZ1 glioma cells. Tumour status was detected by IVIS bioluminescent imaging. n=5. (e) In vivo limiting dilution assay showing that PTPRZ1+ glioma cells exhibit a higher tumour formation incidence than matched PTPRZ1 glioma cells. The tumour formation incidence was determined through IVIS bioluminescent imaging, and the tumour formation efficiency was calculated using Extreme limiting dilution analysis (http://bioinf.wehi.edu.au/software/elda/). n=5, P<0.01, likelihood ratio test. (f) Bioluminescent quantification of intracranial GBM xenografts in d. Data are shown as means±s.e.m., n=5, *P<0.05, Student's t-test. (g) Kaplan–Meier survival analysis of mice implanted with indicated numbers of PTPRZ1+ or PTPRZ1 glioma cells isolated from T0912 GBM. Mice implanted with PTPRZ1+ glioma cells exhibit reduced survival. n=5, log-rank test. (h) Immunoblot analyses of PTPRZ1, the GSC marker SOX2, the astrocytic differentiation marker GFAP and the neuronal differentiation marker MAP2 in GSCs cultured in serum-induced differentiation medium over a 7-day period. Expressions of PTPRZ1 and the GSC marker SOX2 decrease, while expressions of the differentiation markers GFAP and MAP2 concomitantly increase.
Figure 7
Figure 7. Treatment with the anti-PTPRZ1 antibody potently inhibits GSC tumour growth and extends animal survival.
(a) Schematic diagram showing the treatment of GSCs and the GSC-derived xenografts with the anti-PTPRZ1 antibody. GSCs were incubated with the anti-PTPRZ1 antibody (5 μg ml−1) or the isotype control IgG for 72 h followed by orthotopic implantation. After GSC transplantation, mice were treated with the anti-PTPRZ1 antibody (intravenous (i.v.), 2 mg kg−1) or isotype IgG twice per week until moribund. (b,c) Representative bioluminescent images (b) and the quantification (c) of intracranial xenografts derived from T0912 GSCs treated with anti-PTPRZ1 antibody or IgG control at the indicated weeks after GSC transplantation. Data are shown as means±s.e.m., n=5, *P<0.05, **P<0.01, Student's t-test. (d,e) Representative IHC images (d) and the quantification (e) of Ki67 in the xenografts treated with anti-PTPRZ1 antibody or IgG control. The anti-PTPRZ1 antibody treatment significantly inhibited GBM proliferation in the GSC-derived xenografts. Scale bar represents 25 μm. Data are shown as means±s.d., n=5, **P<0.01, Student's t-test. (f,g) Representative IHC images (f) and quantification (g) of SOX2-positive cells in the T0912 xenografts treated with anti-PTPRZ1 antibody or IgG control. Scale bar represents 25 μm. Data are shown as means±s.d., n=5, **P<0.01, Student's t-test. (h) Kaplan–Meier survival curves of the mice bearing the GSC-derived xenografts treated with anti-PTPRZ1 antibody or IgG control. The anti-PTPRZ1 antibody treatment significantly prolonged the survival of mice bearing the GBM xenografts. n=5, P<0.01, log-rank test. d, day.
Figure 8
Figure 8. PTN–PTPRZ1 signalling activates the Fyn–AKT pathway in GSCs.
(a,b) Hierarchical clustering analysis (a) and Kyoto Encyclopedia of Genes and Genomes pathway enrichment analysis (b) of differentially expressed genes between the PTPRZ1-silencing GSCs and control GSCs (fold change ≥2.0). Cluster analyses were performed and visualized using the Cluster/Java Treeview. Pathway enrichment significance is presented as a P value with log2 transformation, Fisher's exact test and χ2-test. (c) Immunoblot analyses of phospho-AKT (p-Ser473) and total AKT in GSCs (T387 and T0912), showing that rhPTN stimulation markedly increases AKT-activating phosphorylation, while the anti-PTPRZ1 antibody treatment compromises rhPTN-stimulated AKT activation in GSCs. Cells were pretreated with anti-PTPRZ1 antibody or control IgG for 1 h followed by rhPTN treatment for 20 min. (d) Co-immunoprecipitation of PTPRZ1 with the Fyn-specific antibody from T387 and T0912 GSC cell lysates. Precipitation with normal rabbit IgG was used as a negative control. PTPRZ1 binds to Fyn in GSCs. (e) Immunoblot analyses of p-SFK (Tyr416) and Fyn in T387 GSCs, showing that rhPTN stimulation markedly increases activating phosphorylation of SFK (p-Tyr416), while the anti-PTPRZ1 antibody treatment largely abrogates SFK activation in GSCs. (f) Co-immunoprecipitation of p-SFK (p-Tyr416) with the Fyn-specific antibody in T387 GSCs. Phosphorylated Fyn, as represented by immunoprecipitated p-SFK with Fyn antibody, was increased after rhPTN exposure, and was compromised by anti-PTPRZ1 antibody. Precipitation with rabbit IgG was used as a negative control.

Similar articles

Cited by

References

    1. Stupp R. et al.. Effects of radiotherapy with concomitant and adjuvant temozolomide versus radiotherapy alone on survival in glioblastoma in a randomised phase III study: 5-year analysis of the EORTC-NCIC trial. Lancet Oncol. 10, 459–466 (2009). - PubMed
    1. Rape A., Ananthanarayanan B. & Kumar S. Engineering strategies to mimic the glioblastoma microenvironment. Adv Drug Deliv. Rev. 79–80, 172–183 (2014). - PMC - PubMed
    1. Lathia J. D., Heddleston J. M., Venere M. & Rich J. N. Deadly teamwork: neural cancer stem cells and the tumor microenvironment. Cell Stem Cell 8, 482–485 (2011). - PMC - PubMed
    1. Garris C. & Pittet M. J. Therapeutically reeducating macrophages to treat GBM. Nat. Med. 19, 1207–1208 (2013). - PubMed
    1. Hambardzumyan D., Gutmann D. H. & Kettenmann H. The role of microglia and macrophages in glioma maintenance and progression. Nat. Neurosci. 19, 20–27 (2015). - PMC - PubMed

Publication types

MeSH terms