. 2017 Jun 1;546(7656):153-157.
doi: 10.1038/nature22361. Epub 2017 May 31.

Deletion of a mycobacterial divisome factor collapses single-cell phenotypic heterogeneity

Affiliations

Deletion of a mycobacterial divisome factor collapses single-cell phenotypic heterogeneity

E Hesper Rego et al. Nature. .

Abstract

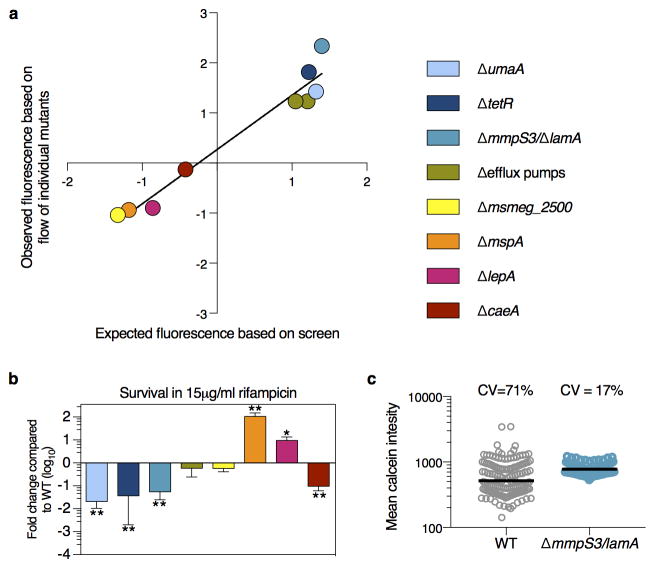
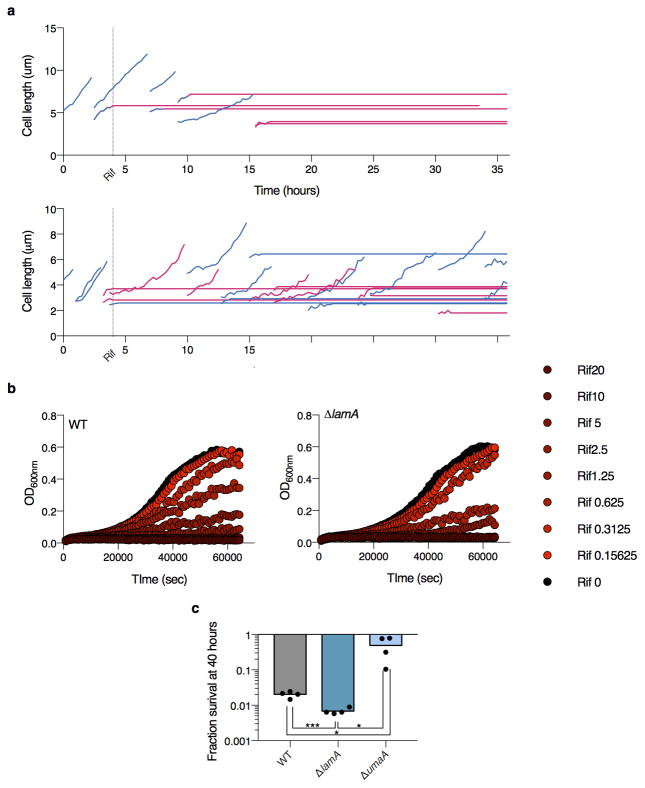
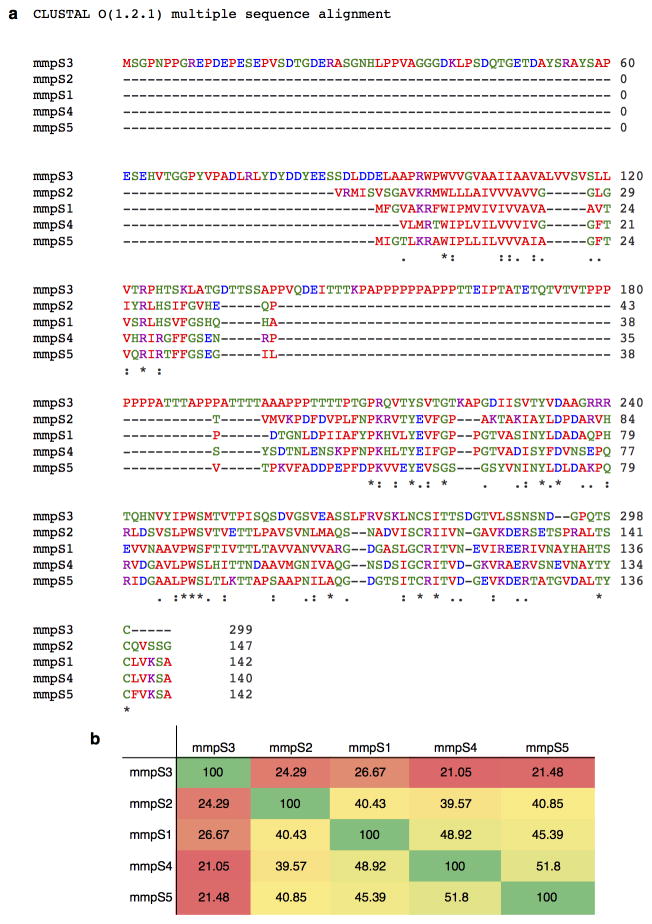
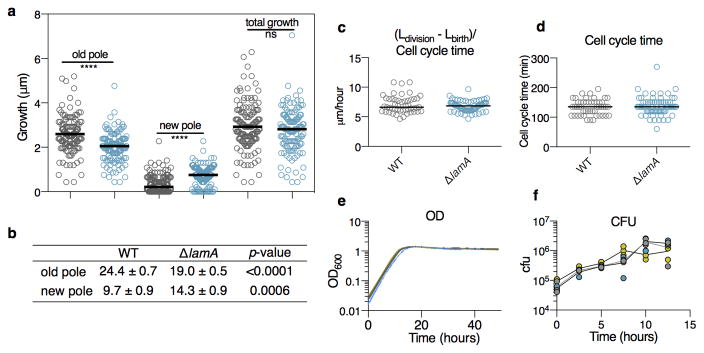
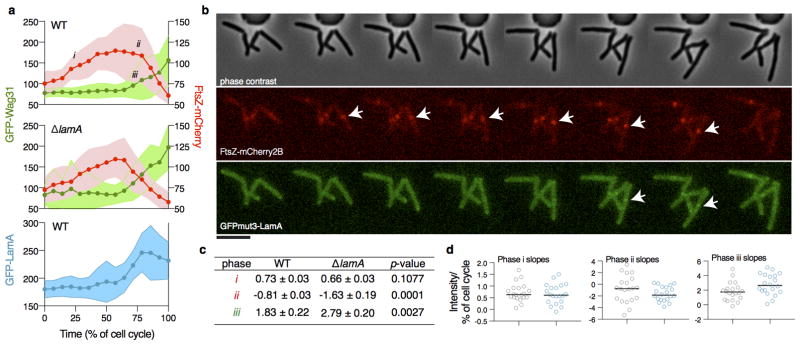
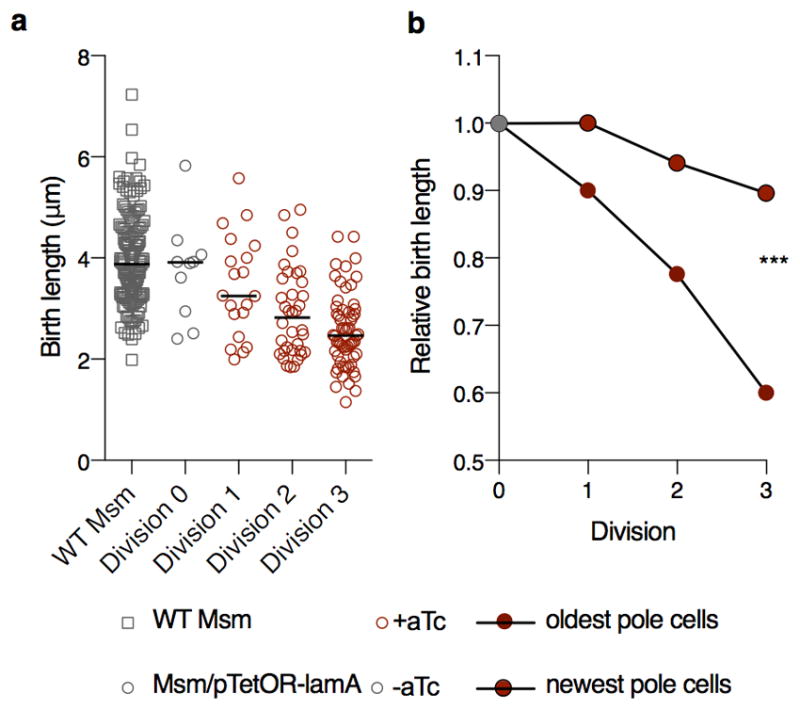
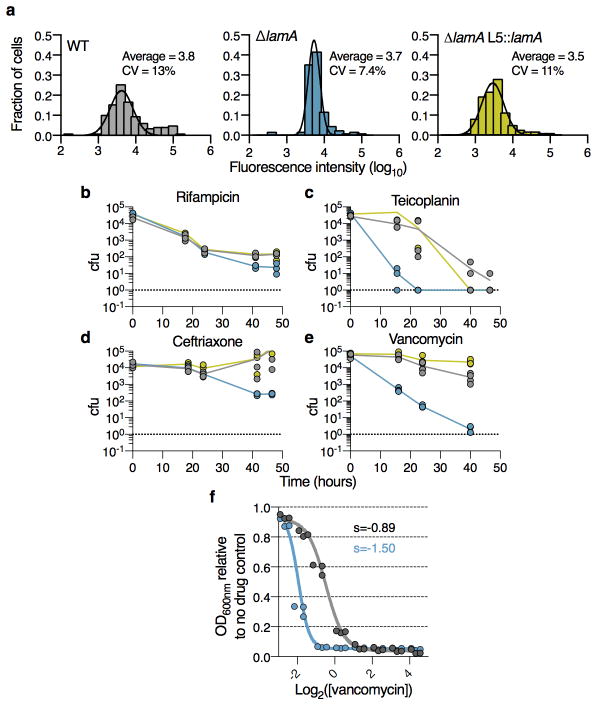
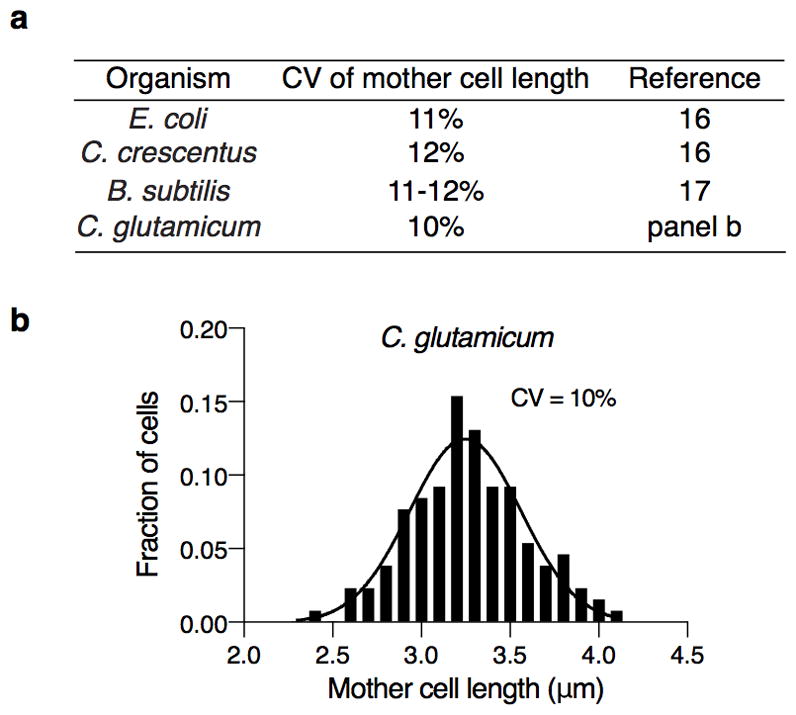
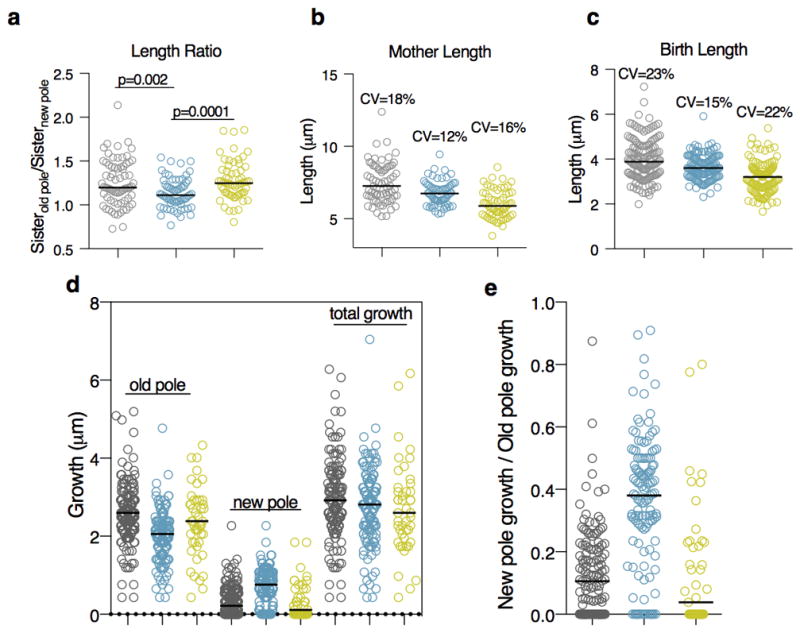
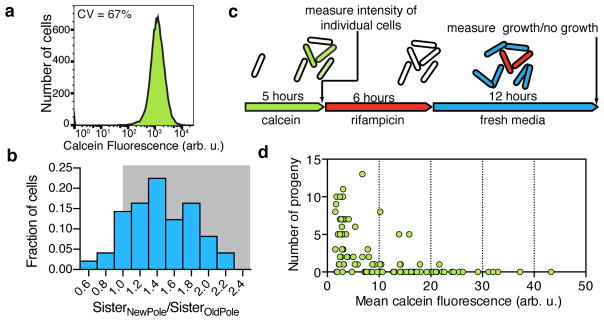
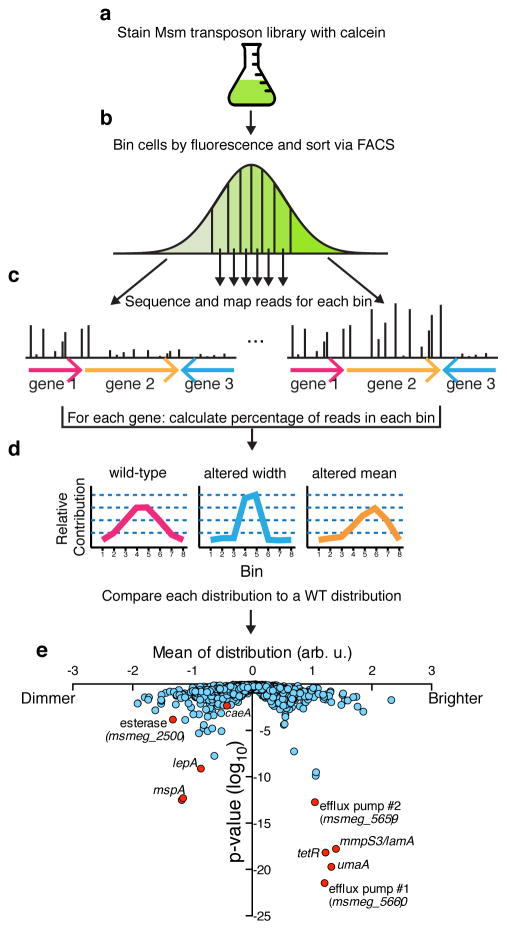
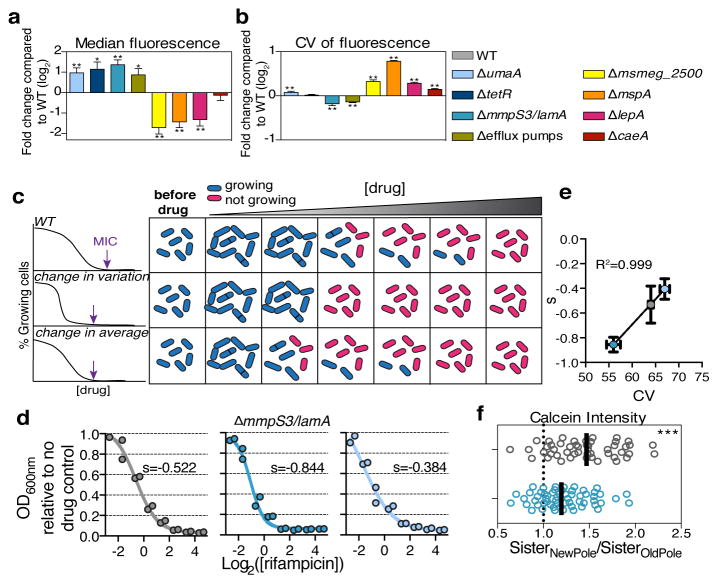
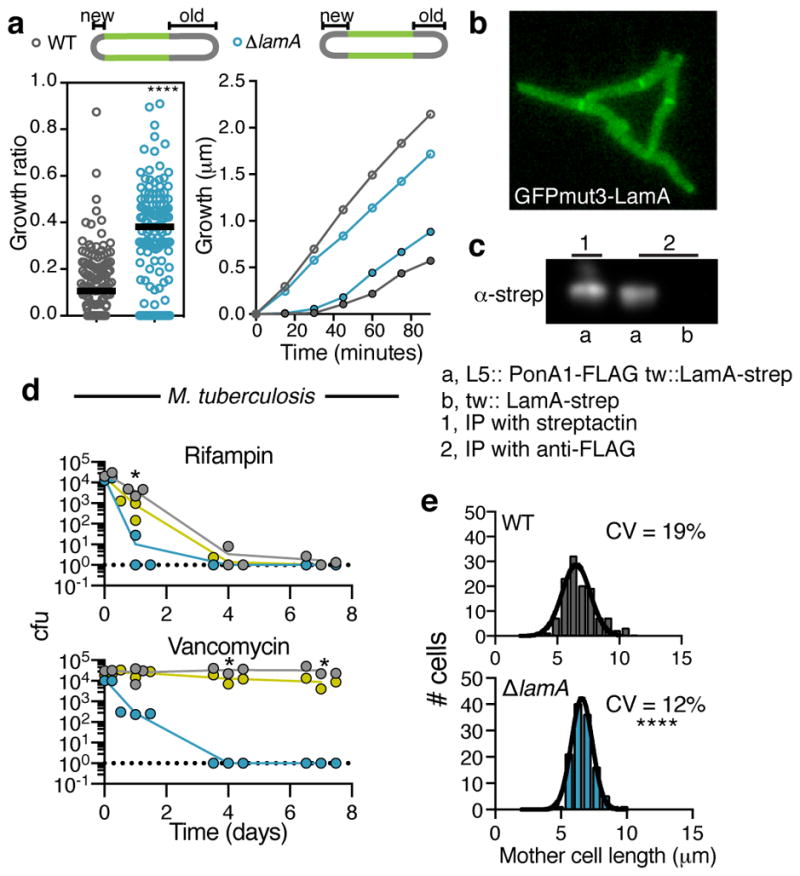
Microorganisms are often studied as populations but the behaviour of single, individual cells can have important consequences. For example, tuberculosis, caused by the bacterial pathogen Mycobacterium tuberculosis, requires months of antibiotic therapy even though the bulk of the bacterial population dies rapidly. Shorter courses lead to high rates of relapse because subpopulations of bacilli can survive despite being genetically identical to those that are easily killed. In fact, mycobacteria create variability each time a cell divides, producing daughter cells with different sizes and growth rates. The mechanism(s) that underlie this high-frequency variation and how variability relates to survival of the population are unknown. Here we show that mycobacteria actively create heterogeneity. Using a fluorescent reporter and a fluorescence-activated cell sorting (FACS)-based transposon screen, we find that deletion of lamA, a gene of previously unknown function, decreases heterogeneity in the population by decreasing asymmetric polar growth. LamA has no known homologues in other organisms, but is highly conserved across mycobacterial species. We find that LamA is a member of the mycobacterial division complex (the 'divisome'). It inhibits growth at nascent new poles, creating asymmetry in polar growth. The kinetics of killing individual cells that lack lamA are more uniform and more rapid with rifampicin and drugs that target the cell wall. Our results show that mycobacteria encode a non-conserved protein that controls the pattern of cell growth, resulting in a population that is both heterogeneous and better able to survive antibiotic pressure.


Conflict of interest statement

The authors declare no competing financial interests.

Figures

Extended Data Figure 1
Extended Data Figure 1. Validation of screen and identification of mutant with decreased heterogeneity
a, The average of 3 biological replicates of the 8 gene deletion strains is stained with calcein and analyzed by flow cytometry. The median of the each strain’s distribution (in units of wild type standard deviation) is compared to the value expected from the screen (slope = 1; R2 = 0.95; error bars represent s.d. assuming independence in the measurements of WT and mutant). b, Survival of 3 biological replicates of each strain is measured by plating and counting survivors after 42 hours in rifampicin treatment and compared to wild type (**p<0.01; *p<0.05, calculated by a two-sided student’s t-test in comparison to WT). c, The average fluorescence value of calcein-stained Msm cells measured by microscopy (n=147 for WT; n=174 for ΔlamA).
Extended Data Figure 2
Extended Data Figure 2. Loss of lamA results in a more homogenous response to drug
a, Two examples of growing lineages of WT Msm cells exposed to 5 μg /ml rifampicin. Blue indicate growing cells, pink indicates non-growing cells. The thick dotted line indicates the time rifampicin was added. Thin dotted lines represent division events. Data for ~100 of cells were recorded. The behavior of single cells was highly variable: many cells stopped growing immediately while others were able to grow and divide in a non-heritable manner. Bulk measurements were recorded in Figure 3d as a way of quantifying the variability over many more cells (~1M cells). b, The geometric mean of two biological replicates for WT and mutant Msm cells growing in sub-MIC concentrations of rifampicin. c, The mean survival of 4 biological replicates at 40 hours in rifampicin at normalized drug concentrations: WT=10 μg /ml; ΔlamA=5 μg /ml; ΔumaA =5 μg /ml.
Extended Data Figure 3
Extended Data Figure 3. mmpS3 is different than the other mmpS genes
a, A clustal omega alignment of all the mycobacterial membrane protein, small (mmpS) genes in the Mtb genomes. b, The percent identity of the mmpS genes are compared to the others.
Extended Data Figure 4
Extended Data Figure 4. Growth properties of ΔlamA cells compared to WT
a, Using a pulse chase experiment as in Figure 4a, the amount of growth at the new and old poles (total growth = new pole + old pole) over the duration of a cell cycle is measured for both WT (grey, n=137) and ΔlamA (blue, n=125) cells. Dark black lines represent medians. b, Slopes were fitted to the data displayed in Fig. 4a. A p-value was calculated using a t-test to compare the slopes of WT and ΔlamA. Growth of WT (grey), ΔlamA (blue), and complement (yellow) as measured by c, elongation rate (n=49 for WT; n=71 for ΔlamA); d, cell cycle time (n=49 for WT; n=71 for ΔlamA). Dark black lines represent medians. c, colony forming units; and d, optical density are measured over time for 3 biological replicates.
Extended Data Figure 5
Extended Data Figure 5. LamA functions during the switch between division and elongation
a, The maximum values of FtsZ-mCherry2B, eGFP-Wag31, and GFPmut3-LamA in the middle of the cell are measured as a function of cell cycle time in both wild type and ΔlamA cells. Shaded areas represent standard deviations across 20 cells for each strain. b,c For each phase indicated in a, the data were fit to a line and the slope was calculated the averaged data are shown in b, while slopes for individual cells are ploted in c. d, An example of the time lapse images that were quantified for panel a. Each panel is 15min apart. Arrows, point to the appearance of either FtsZ or LamA at the septum. Data was recorded ~100 cells, and 20 cells were used for fine quantification shown as shown in panel a. Scale bar: 5μm.
Extended Data Figure 6
Extended Data Figure 6. Overexpression of LamA inhibits growth at the new pole
a, The birth length of a strain carrying a replicating plasmid with LamA under in inducible promoter, pTetOR, (circles) is compared to WT (squares, n=142) in the presence (red) or absence (grey) of inducer (aTc) over many division cycles (n=10 Division 0; n=20 Division 1; n=36 Division 2; n= 60 Division 3). b, Average birth length of 10 cells as a function of birth length before inducer is measured for individual cells overexpressing LamA. Oldest pole cells are cells whose poles were established before inducer was added. Newest pole cells are those whose poles are the newest in the presence of inducer. (***p<0.001 by a two-sided student’s t-test.with Welch’s correction).
Extended Data Figure 7
Extended Data Figure 7. Loss of lamA leads to more uniform drug response for a variety of antibiotics
a, Single-cell intensity of fluorescent-vancomycin stained cells (n=151 WT; n=140 ΔlamA; n=126 ΔlamA L5::lamA). Black lines represent fit of the data to a Guassian curve. Survival over time for WT Msm (grey), ΔlamA (blue), and the complemented strain (yellow) are measured using colony-forming units (n=3 biological replicates): b, Rifampicin 20 μg/ml; c, Teicoplanin 100 μg/ml; d, Ceftrioxone 50 μg/ml with 5 μg/ml clavulanate; e, Vancomycin 3 μg/ml. (*p<0.05 by a two-sided student’s t-test in comparison to WT, dotted line represents limit of detection). f, Cell density of 3 biological replicates in the presence of a range of vancomycin concentrations compared to a no drug control for two strains: WT Msm, and ΔlamA. The solid line represents the fit of the data to a sigmoid function. s is the best-fit value for the slope,
Extended Data Figure 8
Extended Data Figure 8. The variation in a lamA deletion population is similar to the variation seen in other rod-shaped bacteria
a, The variation in length of cells at the time of division (mother cells) for a variety of rod-shaped bacteria b, Length of 130 C. glutamicum cells prior to division. Black line represents the fit of the data to a Guassian function.
Extended Data Figure 9
Extended Data Figure 9. The addition of a copy of lamA onto the chromosome under the native promoter complements all phenotypes and restores heterogeneity
WT (grey), ΔlamA (blue), and complement (yellow). a, Ratio of daughter cells at the time of division (n = 71 sister cell pairs for WT; n=63 sister cell pairs for ΔlamA; n=60 sister cell pairs for complement). The length of cells at the time of b, division (n = 71 cells for WT; n=63 cells for ΔlamA; n=60 cells for complement) and c, birth (n = 142 cells for WT; n=126 cells for ΔlamA; n=120 cells for complement). Using a pulse chase experiment as in Figure 4a and Extended Data 6a, growth at the poles is measured. The absolute values are shown in d, while the ratio of new pole growth to old pole growth is shown in e. (n = 137 cells for WT; n=125 cells for ΔlamA; n=45 cells for complement. Dark black lines represent medians.)
Figure 1
Figure 1. Heterogeneity is important for survival in rifampicin
a, Flow cytometry of calcein-stained Msm cells (Coefficient of Variation (CV) = standard deviation/mean*100). b, Wild type cells are imaged over time in a microfluidic device while calcein AM is continuously added. At the time of cell division, the average calcein intensity of each daughter cell is measured. For 58 sister cell pairs the ratio of the average calcein intensity of the new pole sister to the average calcein intensity of the old pole sister is calculated. c,d, Using the experiment outlined in c the fluorescence of 96 individual cells is measured and compared to the number of progeny that same cell produced during and after rifampicin treatment, shown in d.
Figure 2
Figure 2. Screen for mutants altered in calcein distribution
a, An Msm transposon library is stained with calcein AM b, and 1,200,000 cells are sorted into 8 bins by FACS, with each bin representing 12.5% of the population. c, Each of these binned libraries is deep sequenced and d, distributions are made for each gene that represents the fraction of reads in each bin for that gene. Below are cartoons of potential distributions that are analogous to an effective fluorescent distribution for a single mutant. e, For each gene or intergenic region the mean of the effective fluorescent distribution is determined and plotted against a Mann-Whitney U p-value, which is derived from comparing each gene’s distribution to a calculated wild type distribution. We picked 9 genes (shown in red) and made 8 gene deletions strains (Supplementary Table 2).
Figure 3
Figure 3. Validation of mutants from screen and identification of lamA
Each of the 8 gene deletion strains is stained with calcein and 3 biological replicates are analyzed by flow cytometry. a, The mean ratio of the median calcein fluorescence for each mutant compared to wild type. b, The mean ratio of the mutant CV compared to wild type CV. (for a,b: **p<0.01; *p<0.05, calculated by a two-sided student’s t-test in comparison to WT; error bars represent s.d. assuming independence in the measurements of WT and mutant). c, An illustrative summary of two potential mutants. In WT, a subpopulation of cells can grow at drug concentrations that stop growth of the majority of the population. In a less variable mutant, this population represents much less of the total population, and cells exhibit a more “all or nothing” phenotype. In a mutant that is altered in the average behavior, but maintains WT-level variability, the growing subpopulation continues to exist, although it stops growing at lower concentrations that WT. The MIC (purple arrow) is lower in either case. d, Cell density in the presence of a range of rifampicin concentrations compared to a no drug control for three strains (n=2 biological replicates): WT, ΔlamA, and ΔumaA. The solid line represents the fit of the data to a sigmoid function. s is the best-fit value for the slope. e, The slope shown in panel d is correlated to the CV shown in panel b. (y-axis error bars represent range, x-axis represent s.d.) f, The ratio of calcein accumulation between sister cells is measured for WT and for ΔlamA cells (n=58 sister pairs for WT (grey); n=49 sister pairs for ΔlamA (blue); dark black lines represent medians; ***p<0.001; calculated by two-sided student’s t-test with Welch’s correction in comparison to WT).
Figure 4
Figure 4. LamA creates asymmetry in polar growth and is a member of the divisome
a, Using a pulse-chase experiment with an amine reactive dye as described in ref. the amount of growth at the new and old poles is measured over the duration of the cell cycle. left panel: The ratio of growth (new pole/old pole) for single cells (n=137 cell for WT; n=125 cells for ΔlamA; dark black lines represent medians; the absolute values are shown in Extended Data Fig 6a). right panel: Using the same pulse chase experiment, growth is followed after septation at finer time increments. Time refers to the time after septation. (Old pole= open circles; New pole = closed circles; points represent averages of 20 cells). b, A representative image at a single time point of GFPmut3-LamA in WT Msm cells. Data was recorded for ~100 cell at t=0. c, α-strep western blot of immune-precipitates by indicated method (streptactin or anti-FLAG). Pull-down with α-FLAG was performed twice and LamA-strep was seen both times. a,b are different strains with ponA1-FLAG or lamA-strep integrated at the indicated phage sites (L5 or tweety (tw)). d, Survival of WT Mtb (grey), ΔlamA (blue), and complemented strain (yellow) is measured over time in the presence of 0.3 μg/ml rifampicin or 4 μg/ml vancomycin for 3 biological replicates. (Dotted line represents limit of detection; *p<0.05 by student’s t-test in comparison to WT) e, The distribution for the length of cells just prior to division (mother cells) for WT (n=120) and ΔlamA (n=120) cell. (For a,e **** p<0.0001; by a two-sided student’s t-test with Welch’s correction to compare either mean (a) or variation (e)).

Comment in

References

    1. Mitchison DA. Role of individual drugs in the chemotherapy of tuberculosis. The International Journal of Tuberculosis and Lung Disease. 2000;4:796–806. - PubMed
    1. Aldridge BB, et al. Asymmetry and aging of mycobacterial cells leads to variable growth and antibiotic susceptibility. Science. 2012;335:100–104. - PMC - PubMed
    1. Santi I, Dhar N, Bousbaine D, Wakamoto Y, McKinney JD. Single-cell dynamics of the chromosome replication and cell division cycles in mycobacteria. Nature communications. 2013;4:2470. - PubMed
    1. Chiu VC, Haynes DH. High and low affinity Ca2+ binding to the sarcoplasmic reticulum: use of a high-affinity fluorescent calcium indicator. Biophysical Journal. 1977;18:3–22. - PMC - PubMed
    1. Tiberghien F, Loor F. Ranking of P-glycoprotein substrates and inhibitors by a calcein-AM fluorometry screening assay. Anti-Cancer Drugs. 1996;7:568–578. - PubMed

Publication types

MeSH terms