. 2017 Jun 2;2(11):e92512.
doi: 10.1172/jci.insight.92512.

Delayed decompression exacerbates ischemia-reperfusion injury in cervical compressive myelopathy

Affiliations

Delayed decompression exacerbates ischemia-reperfusion injury in cervical compressive myelopathy

Pia M Vidal et al. JCI Insight. .

Abstract

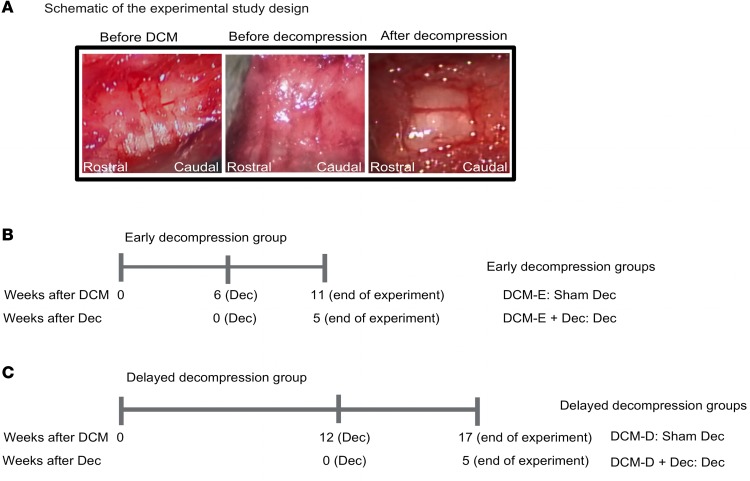
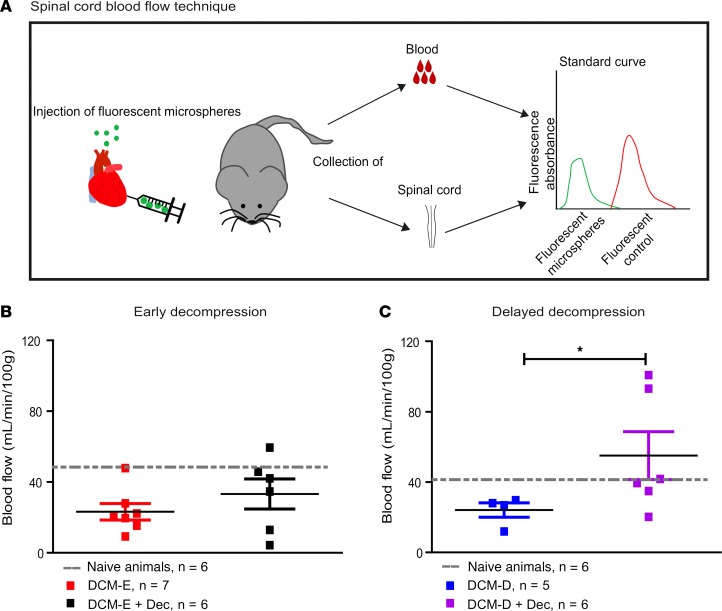
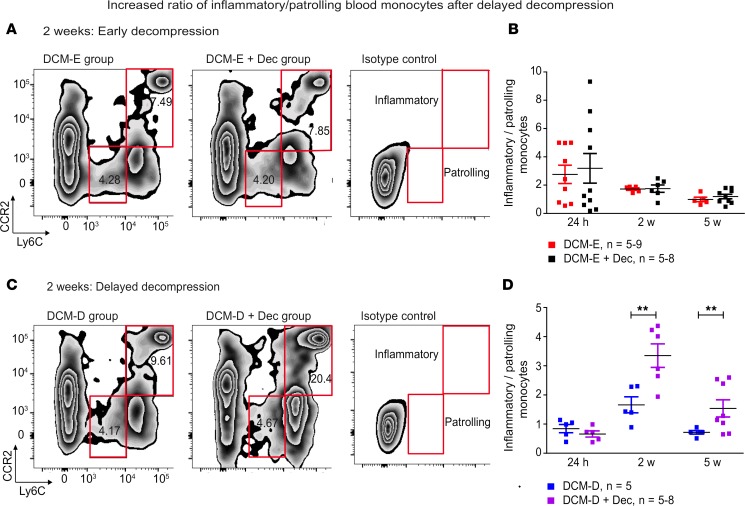
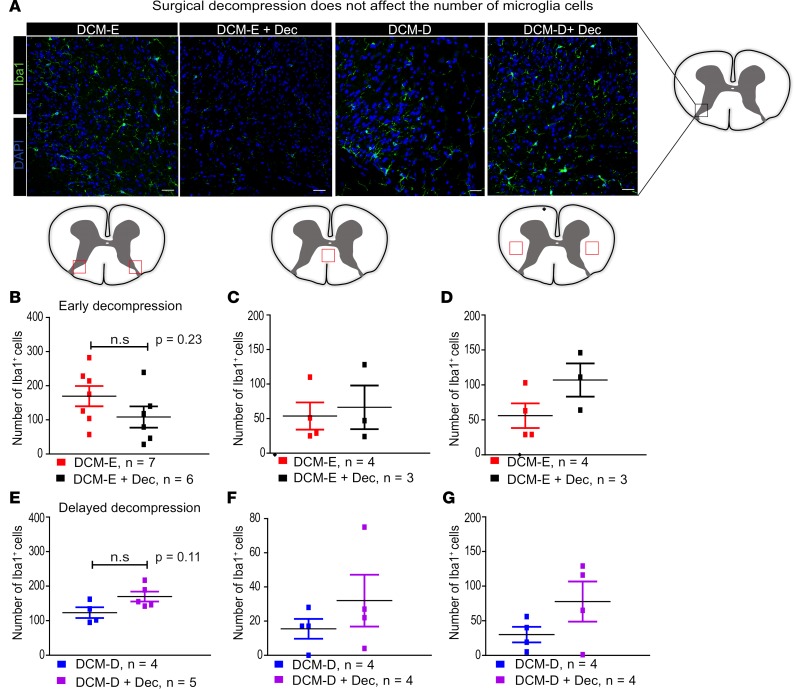
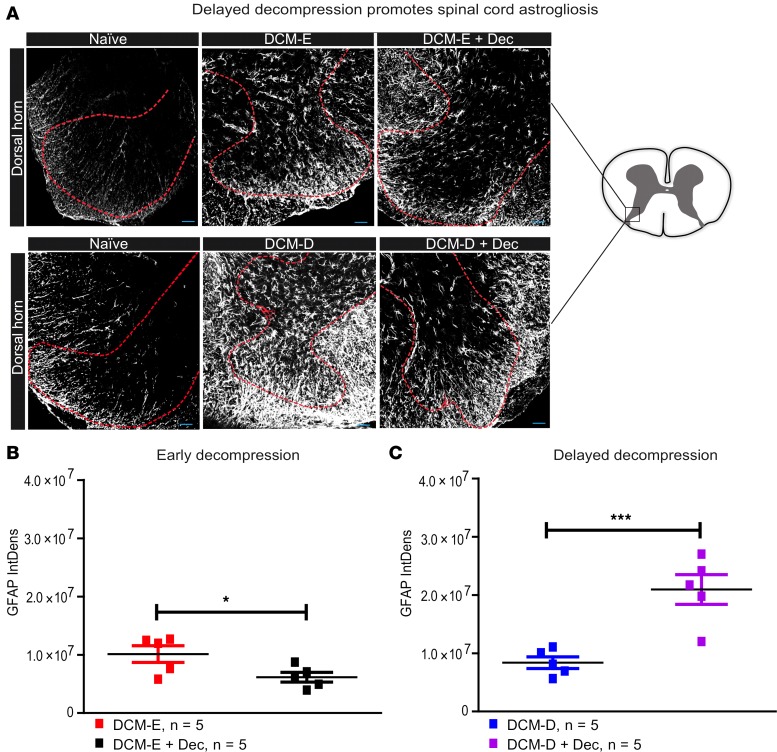
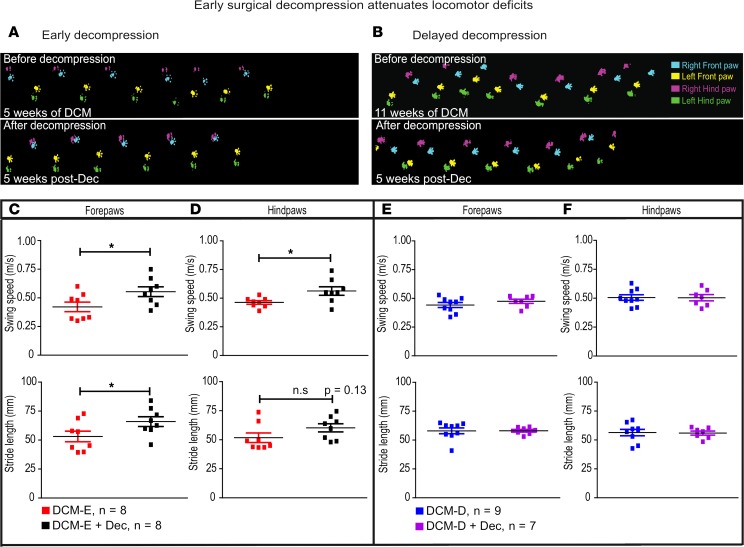
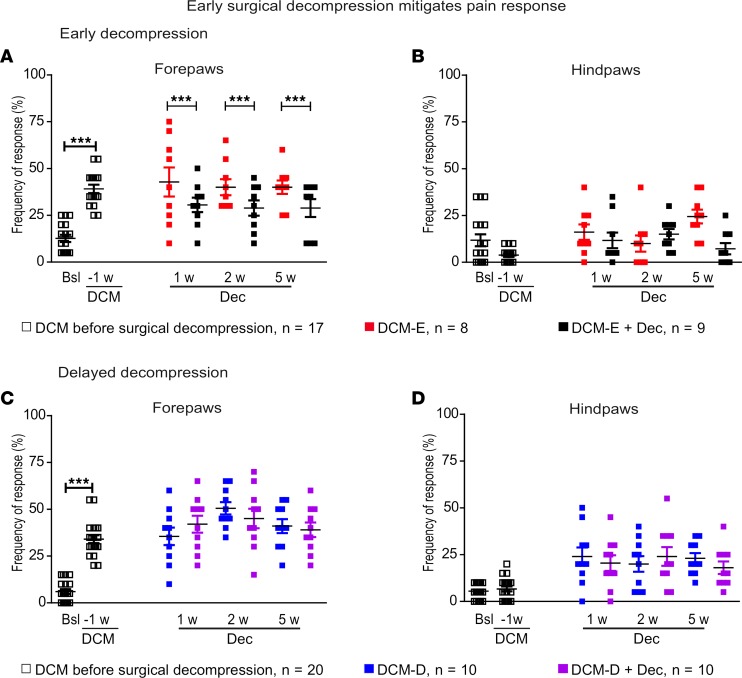
Degenerative cervical myelopathy (DCM) is the most common progressive nontraumatic spinal cord injury. The most common recommended treatment is surgical decompression, although the optimal timing of intervention is an area of ongoing debate. The primary objective of this study was to assess whether a delay in decompression could influence the extent of ischemia-reperfusion injury and alter the trajectory of outcome in DCM. Using a DCM mouse model, we show that decompression acutely led to a 1.5- to 2-fold increase in levels of inflammatory cytokines within the spinal cord. Delayed decompression was associated with exacerbated reperfusion injury, astrogliosis, and poorer neurological recovery. Additionally, delayed decompression was associated with prolonged elevation of inflammatory cytokines and an exacerbated peripheral monocytic inflammatory response (P < 0.01 and 0.001). In contrast, early decompression led to resolution of reperfusion-mediated inflammation, neurological improvement, and reduced hyperalgesia. Similar findings were observed in subjects from the CSM AOSpine North America and International studies, where delayed decompressive surgery resulted in poorer neurological improvement compared with patients with an earlier intervention. Our data demonstrate that delayed surgical decompression for DCM exacerbates reperfusion injury and is associated with ongoing enhanced levels of cytokine expression, microglia activation, and astrogliosis, and paralleled with poorer neurological recovery.

Keywords: Inflammation; Neuroscience.


Conflict of interest statement

Conflict of interest: The authors have declared that no conflict of interest exists.

Figures

Figure 1
Figure 1. Experimental design.
(A) Representative intraoperative images of the spinal cord before material implantation (before DCM), of a compressed animal before and after decompression (from left to right, respectively). (B and C) Scheme of the time points assessed for early and delayed decompression. The time is provided based on (i) weeks after induction of DCM and (ii) after decompression. In these timelines, time 0 refers to either the time of material implantation (see weeks after DCM) or the time of decompression (see weeks after Dec). Mice in the early-decompressed group were operated at 6 weeks after DCM by receiving decompression (DCM-E + Dec) or a sham decompression (DCM-E) (B). Similarly, the delayed-decompressed group received decompression (DCM-D + Dec) or sham decompression (DCM-D), but at 12 weeks after material implantation (C). Both groups were sacrificed at 24 hours and 2 and 5 weeks after their decompressive surgery, and tissues of interest were collected. Neurobehavioral assessment was carried out until 5 weeks after surgery. DCM, degenerative cervical myelopathy; Dec, decompression; DCM-E, age-matched early sham decompressed group; DCM-D, age-matched delayed sham decompressed group.
Figure 2
Figure 2. Surgical decompression reduces compression ratio.
(A) Representative MR images of mice: naive, 5 weeks after degenerative cervical myelopathy (DCM), and 5 weeks after surgical decompression (DCM-E + Dec). (B) At 1 week before surgical decompression, the DCM group had a 32% compression ratio, which was significantly reduced to 14.4% in the DCM-E + Dec group (n = 5 animals per group). *P < 0.05, Mann-Whitney U test. (C) Representative MR images of mice: naive, DCM (at 11 weeks after DCM), and DCM-D + Dec (at 5 weeks after surgical decompression). (D) At 1 week before surgical decompression, the DCM group had a 47% compression ratio, which was reduced to 12.8% at 5 weeks after decompression in the DCM-D + Dec group (n = 5 per group). *P < 0.05, Mann-Whitney U test. Compression ratio was calculated based on Fehlings et al. (76), and the data are presented as mean ± SEM.
Figure 3
Figure 3. Delayed decompression increases long-term blood flow in the spinal cord.
(A) Schematic representation of the technique that measures spinal cord blood flow using fluorescent microparticles injected into the mouse heart. Fluorescence absorbance of microparticles in blood and spinal cord was measured and the obtained values were normalized to a standard curve. (B) At 5 weeks after early decompression, blood flow reached 33.2 ± 20.8 ml/min/100 g in the DCM-E + Dec group, whereas animals in the DCM-E group had a blood flow of 23.2 ±12.2 ml/min/100 g. Age-matched naive animals had blood flow values of 42.1 ± 13.5 ml/min/100 g. Naive animals (n = 6), DCM-E (n = 7), DCM-E + Dec (n = 6). (C) At 5 weeks after delayed surgical decompression, blood flow was significantly increased to 55.10 ml/min/100 g in the DCM-D + Dec group compared with 24.2 ml/min/100 g in the DCM-D group. *P < 0.05, Mann-Whitney U test. Age-matched naive animals presented blood flow values of 40 ml/min/100 g ± 13.3 ml/min/100 g. Naive animals (n = 6), DCM-D (n = 5), and DCM-D + Dec (n = 6). All data are presented as mean ± SEM. DCM, degenerative cervical myelopathy; Dec, decompression; DCM-E, age-matched early sham decompressed group; DCM-D, age-matched delayed sham decompressed group.
Figure 4
Figure 4. Surgical decompression triggers acute release of cytokines within the spinal cord, which persist after delayed decompression.
(A) ELISA results from homogenized spinal cord tissue indicated increased levels of inflammatory factors (G-CSF, IL-6, CXCL10, LIF, CCL-3, CCL-2) in the DCM-E + Dec group compared with the DCM-E group acutely after decompression (at 24 hours). *P < 0.05; **P < 0.01, two-way ANOVA, Bonferroni post-hoc. A group of naive animals with the same age as the animals at 5 weeks after decompression was also included. Naive (n = 3–4), DCM-E (n = 5), and DCM-E + DC groups (n = 5–6). (B) At 24 hours after delayed decompression, the DCM-D + Dec group presented a significant increase levels of G-CSF, IL-6, CXCL10, LIF, CCL-3, and CCL-2 compared with the DCM-D group. Moreover, levels of CXCL10, LIF, CCL-3, and CCL-2 were elevated at 2 and 5 weeks in the DCM-D + Dec group compared with the DCM-D group. Naive animals matching the age of animals at 5 weeks after decompression were included for reference. *P < 0.05; **P < 0.01; ***P ≤ 0.001, two-way ANOVA, Bonferroni post-hoc. Naive (n = 3), DCM-D (n = 5), DCM-D + Dec (n = 5–7). Data are presented as mean ± SEM. DCM, degenerative cervical myelopathy; Dec, decompression; DCM-E, age-matched early sham decompressed group; DCM-D, age-matched delayed sham decompressed group; h, hours; w, weeks.
Figure 5
Figure 5. Delayed surgical decompression increases the ratio of inflammatory/patrolling blood monocytes.
(A) Blood samples were transcardially collected at selected time points in the DCM-E and DCM-E + Dec groups. Representative contour plots of blood monocytes for DCM-E, DCM-E + Dec, and isotype controls at 2 weeks after surgical decompression. Inflammatory monocytes were gated as Ly6ChiCCR2+ (upper red panel) and patrolling monocytes as Ly6CloCCR2 (lower red panel). (B) The ratio of inflammatory/patrolling monocytes was not significantly different between the DCM-E and DCM-E + Dec groups at all time points (24 hours [DCM-E, n = 9; DCM-E + Dec, n = 10], 2 weeks [DCM-E, n = 5; DCM-E + Dec, n = 6], and 5 weeks [DCM-E, n = 5; DCM-E + Dec, n = 9]). (C) Representative contour plots of inflammatory and patrolling blood monocytes for DCM-D, DCM-D + Dec, and isotype control at 2 weeks after surgical decompression. (D) The ratio of inflammatory/patrolling monocytes was similar between DCM-D and DCM-D + Dec groups at 24 hours after surgery (DCM-D, n = 5; DCM-D + Dec, n = 5). However, this ratio was higher in the group receiving delayed decompression as compared with the same group, at 2 and 5 weeks after decompression (DCM-D, n = 5; DCM-D + Dec, n = 5–8). **P < 0.01, two-way ANOVA. Data are presented as mean ± SEM. DCM, degenerative cervical myelopathy; Dec, decompression; DCM-E, age-matched early sham decompressed group; DCM-D, age-matched delayed sham decompressed group.
Figure 6
Figure 6. Surgical decompression does not affect the number of recruited microglia/macrophages in the spinal cord.
(A) Representative images of Iba1+ cells in the dorsal horn from mice at 5 weeks after either early or delayed decompression and age-matched sham controls. (B) At 5 weeks after decompression, Iba1+ cells were quantified in the regions of dorsal horns outlined by red squares, as indicated in the spinal cord diagram. A slight decrease in Iba1+ cells was detected in the dorsal horns of the DCM-E + Dec group (n = 6) compared with the DCM-E group (n = 7). (C and D) No significant differences were observed in the DCM-E group (n = 4) compared with the DCM-E + Dec (n = 3) in the dorsal columns (C) and the lateral corticospinal tracts (D). In all cases, the analyzed area is represented by the red squares in the diagram of the spinal cord. (EG) No significant changes were observed in the number of Iba1+ cells in the dorsal horns (E), dorsal columns (F), and lateral corticospinal tracts (G) between the DCM-D (n = 4) and DCM-D + Dec (n = 5–4) at 5 weeks after decompression. All the results are presented as mean ± SEM of 5 to 6 slides per animal. Scale bars: 25 μm. DCM, degenerative cervical myelopathy; Dec, decompression; DCM-E, age-matched early sham decompressed group; DCM-D, age-matched delayed sham decompressed group.
Figure 7
Figure 7. Delayed decompression induces increased levels of Galectin-3 in the spinal cord.
(A) Representative Western blot results of Galectin-3 expression and their respective loading control β-actin for the DCM-E (n = 5) and DCM-E + Dec (n = 5) groups at 5 weeks after decompression. Densitometric quantification revealed minor expression of Galectin-3 in the spinal cord from both groups. Data were analyzed using a Mann-Whitney U test. (B) Representative Western blot of Galectin-3 expression and β-actin in the DCM-D and DCM-D + Dec groups at 5 weeks after decompression. Quantification of Galectin-3 in DCM-D (n = 5) and DCM-D + Dec (n = 7) groups shows a significant increase in the expression of this marker at 5 weeks after decompression. **P < 0.01, Mann-Whitney U test. DCM, degenerative cervical myelopathy; Dec, decompression; DCM-E, age-matched early sham decompressed group; DCM-D, age-matched delayed sham decompressed group.
Figure 8
Figure 8. Early decompression attenuates astrogliosis in the dorsal horns.
(A) Representative confocal images of dorsal horns from mice that underwent early or delayed decompression, their age-matched sham controls, and age-matched naive mice, all stained for glial fibrillary acidic protein (GFAP). The red dotted lines delineate the dorsal horns where GFAP immunoreactivity was quantified. The spinal cord diagram on the right side represents the area of constant size within the dorsal horns, used for the analysis of GFAP immunoreactivity. (B) GFAP immunoreactivity was significantly reduced at 5 weeks after decompression in the DCM-E + Dec (n = 5) group compared with the age-matched DCM-E group (n = 5). *P < 0.05, Mann-Whitney U test. (C) Astrogliosis was significantly increased in the dorsal horns of DCM-D + Dec (n = 5) compared with the DCM-D group (n = 5). ***P < 0.001, Mann-Whitney U test. All the results are presented as mean ± SEM. Scale bars: 25 μm. DCM, degenerative cervical myelopathy; Dec, decompression; DCM-E, age-matched early sham decompressed group; DCM-D, age-matched delayed sham decompressed group; IntDens, integrated density.
Figure 9
Figure 9. Early surgical decompression attenuates gait deficits.
(A and B) Representative footprints from mice with DCM before and after undergoing early (A) or delayed (B) decompression using CatWalk. (C) In the forepaws, swing speed and stride length increased significantly at 5 weeks in the DCM-E + Dec group compared with the DCM-E group. *P < 0.05, Mann-Whitney U test. (D) In hind limbs, only swing speed was significantly increased (n = 8 animals per group, data represent the mean of 3 runs per animal). *P < 0.05, Mann-Whitney U test. (E and F) Delayed decompression did not attenuate gait deficits in any of the limbs in the DCM-D + Dec group (n = 7) compared with the DCM-D group (n = 9) at 5 weeks after surgery. Mann-Whitney U test. All data are presented as mean ± SEM. DCM, degenerative cervical myelopathy; Dec, decompression; DCM-E, age-matched early sham decompressed group; DCM-D, age-matched delayed sham decompressed group.
Figure 10
Figure 10. Early surgical decompression improves upper extremity function.
(A) Early surgical decompression improves muscle/grip strength as assessed with the wire hang test. The latency to fall from the grid was significantly increased in the DCM-E + Dec group compared with the DCM-E group at the 1-, 2-, and 5-week time points. *P < 0.05, two-way ANOVA. Open squares at the –1w (1 week before surgical decompression) denotes all the animals before decompression. (B) No significant changes were observed in the group that underwent delayed surgery at any time point. (C) Representative images of DCM animals performing the wire hang test. The white arrows indicate different ways that decompressed animals hold onto the grid with the 4 limbs. The number of animals used was as follows: DCM-E group before surgical decompression (n = 15); DCM-E (n = 7); DCM-E + Dec (n = 8); DCM-D group before surgical decompression (n = 17), DCM-D (n = 9); DCM-D + Dec (n = 8). The dot plot at each time point represents the mean of 3 measurements per animal. (D) Manual dexterity using the Capellini handling test was measured as the time the animals spent eating a piece of 2.6-cm-long pasta. The DCM-E group before decompression experienced a significant increase in the time spent eating the pasta compared with naive animals. **P < 0.01, one-way ANOVA. The DCM-E + Dec group spent less time eating the pasta compared with the DCM-E group, at the 3-day, 4-day, and 5-week time points. *P < 0.05, one-way ANOVA. (E) Mice in the DCM-D group spent more time eating pasta, compared with naive animals. *P < 0.05, one-way ANOVA. However, no significant changes were detected at any time point after decompression. (F) Representative images of DCM animals performing the Capellini handling test. Some abnormal eating patterns were observed in DCM animals, such as head tilt and grabbing the pasta with 1 forepaw and hind limb on the floor. Naive animals (n = 3); DCM-E group before surgical decompression (n = 12); DCM-E + Dec (n = 7–12); DCM-D group before surgical decompression (n = 8); DCM-D + Dec (n = 7–8). The dot plot at each time point represents the mean of 3 measurements per animal. The results are presented as mean ± SEM. DCM, degenerative cervical myelopathy; Dec, decompression; DCM-E, age-matched early sham decompressed group; DCM-D, age-matched delayed sham decompressed group; w, weeks.
Figure 11
Figure 11. Surgical decompression reduces pain response.
Mechanical allodynia was measured in mice in their fore and hind paws using a 0.4-g von Frey hair filament before DCM, during DCM, and after decompression. (A) The early-decompressed group was assessed before DCM (Bsl), 1 week before decompression (–1), as well as at 1, 2, and 5 weeks after decompressive surgery. We detected higher responses in the forepaws of animals in the DCM-E group compared with the Bsl time point. ***P < 0.001, two-tailed t test. Early surgical decompression reduced pain in the forepaws compared with the DCM-E group at all time points studied. ***P < 0.001, linear mixed model. (B) Pain response in the hind paws of the DCM-E group was not significantly affected at any time point. DCM-E before surgical decompression (n = 17); DCM-E (n = 8); DCM-E + Dec (n = 9). (C) Pain response was significantly increased in the forepaws of DCM-D animals compared with Bsl (***P < 0.001, two-tailed t test), without significant changes between the DCM-D and DCM-D + Dec groups. (D) In the hind paws, pain response was not significantly affected at any time point. DCM-D before surgical decompression (n = 20); DCM-D (n = 10); and DCM-D + Dec (n = 10). Each dot plot represents the mean of 10 measurements per paw, per animal. Results are presented as mean ± SEM. DCM, degenerative cervical myelopathy; Dec, decompression; DCM-E, age-matched early sham decompressed group; DCM-D, age-matched delayed sham decompressed group; w, weeks.

References

    1. Nouri A, Tetreault L, Singh A, Karadimas SK, Fehlings MG. Degenerative cervical myelopathy: epidemiology, genetics, and pathogenesis. Spine. 2015;40(12):E675–E693. doi: 10.1097/BRS.0000000000000913. - DOI - PubMed
    1. Tetreault L, et al. Degenerative cervical myelopathy: a spectrum of related disorders affecting the aging spine. Neurosurgery. 2015;77 Suppl 4:S51–S67. - PubMed
    1. Fehlings MG, et al. A global perspective on the outcomes of surgical decompression in patients with cervical spondylotic myelopathy: results from the prospective multicenter AOSpine International study on 479 patients. Spine. 2015;40(17):1322–1328. doi: 10.1097/BRS.0000000000000988. - DOI - PubMed
    1. Fehlings MG, et al. Efficacy and safety of surgical decompression in patients with cervical spondylotic myelopathy: results of the AOSpine North America prospective multi-center study. J Bone Joint Surg Am. 2013;95(18):1651–1658. doi: 10.2106/JBJS.L.00589. - DOI - PubMed
    1. Karadimas SK, et al. Riluzole blocks perioperative ischemia-reperfusion injury and enhances postdecompression outcomes in cervical spondylotic myelopathy. Sci Transl Med. 2015;7(316):316ra194. doi: 10.1126/scitranslmed.aac6524. - DOI - PubMed