

Four phases of the Flint Water Crisis: Evidence from blood lead levels in children
- PMID: 28570960
- PMCID: PMC5538017
- DOI: 10.1016/j.envres.2017.05.028
Four phases of the Flint Water Crisis: Evidence from blood lead levels in children
Abstract
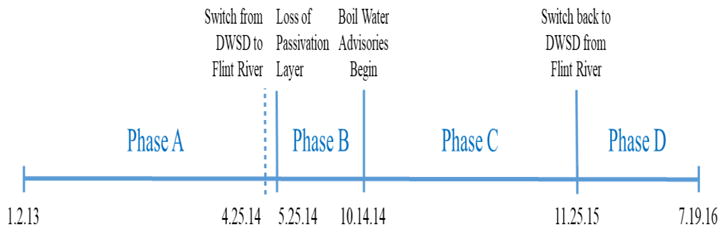
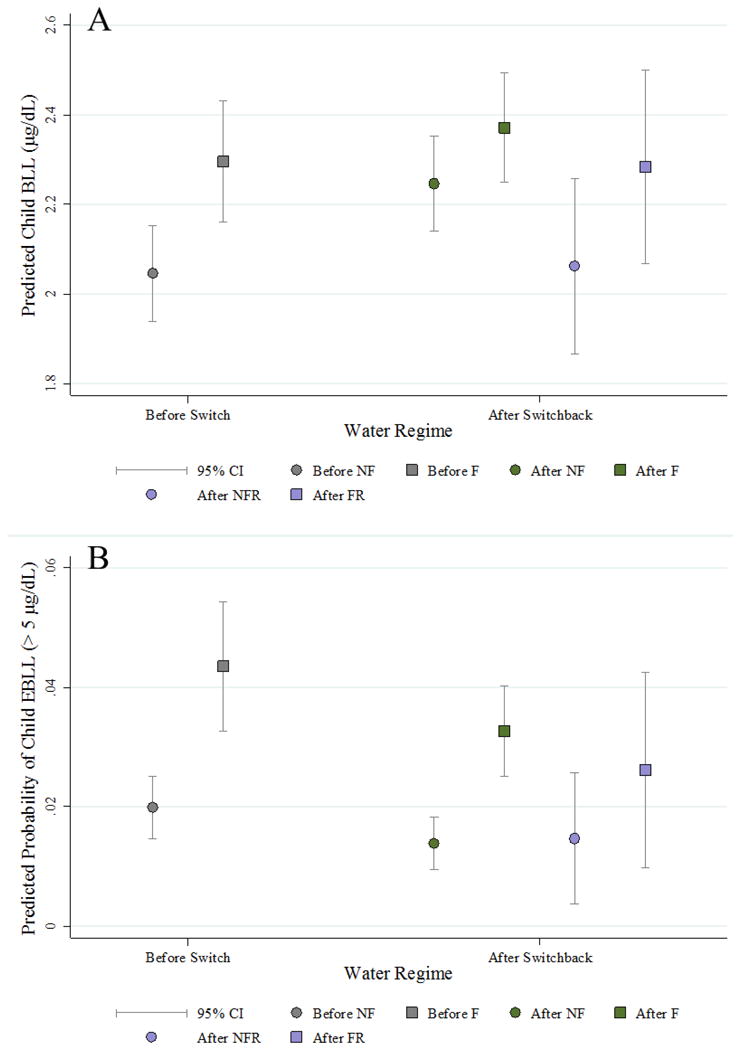
The Flint Water Crisis (FWC) is divisible into four phases of child water-lead exposure risk: Phase A) before the switch in water source to the Flint River (our baseline); Phase B) after the switch in water source, but before boil water advisories; Phase C) after boil water advisories, but before the switch back to the baseline water source of the Detroit Water and Sewerage Department (DWSD); and Phase D) after the switch back to DWSD. The objective of this work is to estimate water-lead attributable movements in child blood lead levels (BLLs) that correspond with the four phases in the FWC. With over 21,000 geo-referenced and time-stamped blood lead samples from children in Genesee County drawn from January 01, 2013 to July 19, 2016, we develop a series of quasi-experimental models to identify the causal effect of water-lead exposure on child BLLs in Flint. We find that the switch in water source (transitioning from phase A to B) caused mean BLLs to increase by about 0.5μg/dL, and increased the likelihood of a child presenting with a BLL ≥ 5μg/dL by a factor of 1.91-3.50, implying an additional 561 children exceeding 5μg/dL. We conservatively estimate cohort social costs (through lost earnings alone) of this increase in water-lead exposed children at $65 million, contrasted with expected annual savings of $2 million from switching water source. On the switch from Phase B to C, we find BLLs decreased about 50% from their initial rise following boil water advisories and subsequent water avoidance behaviors by households. Finally, the return to the baseline source water (Phase D) returned child BLLs to pre-FWC levels further implicating water-lead exposure as a causal source of child BLLs throughout the FWC.
Keywords: Blood lead levels; Child BLLs; Child health; Flint Water Crisis; Lead exposure.
Copyright © 2017 The Authors. Published by Elsevier Inc. All rights reserved.
Figures
References
-
- Centers for Disease Control and Prevention (CDC) Low Level Lead Exposure Harms Children: A Renewed Call of Primary Prevention. Vol. 2013. Centers for Disease Control and Prevention; 2012a. CDC Response to Advisory Committee on Childhood Lead Poisoning Prevention Recommendations.
-
- CDC. Report of the Advisory Committee on Childhood Lead Poisoning and Prevention of the Centers for Disease Control and Prevention. Vol. 2014. Centers for Disease Control and Prevention; 2012b. Low Level Lead Exposure Harms Children: A Renewed Call for Primary Prevention.
-
- Christensen P, Keiser DA, Lade GE. Mimeo. Iowa State University; 2017. The Effects of Information Provision on Housing Markets and Avoidance Behavior: Evidence from the Flint, MI Drinking Water Crisis.
-
- Davis MM, et al. Flint Water Advisory Task Force - Final Report. Office of Governor Rick Snyder. 2016:115.
-
- U.S. Department of Health and Human Services (DHHS) Monograph on the Health Effects of Low-level Lead. U.S. Department of Health and Human Services; 2012.
Publication types
MeSH terms
Substances
Grants and funding
LinkOut - more resources
Full Text Sources
Other Literature Sources
Medical
