. 2017 May 30;125(5):057006.
doi: 10.1289/EHP788.

Characterization of Variability in Toxicokinetics and Toxicodynamics of Tetrachloroethylene Using the Collaborative Cross Mouse Population

Affiliations

Characterization of Variability in Toxicokinetics and Toxicodynamics of Tetrachloroethylene Using the Collaborative Cross Mouse Population

Joseph A Cichocki et al. Environ Health Perspect. .

Abstract

Background: Evaluation of interindividual variability is a challenging step in risk assessment. For most environmental pollutants, including perchloroethylene (PERC), experimental data are lacking, resulting in default assumptions being used to account for variability in toxicokinetics and toxicodynamics.

Objective: We quantitatively examined the relationship between PERC toxicokinetics and toxicodynamics at the population level to test whether individuals with increased oxidative metabolism are be more sensitive to hepatotoxicity following PERC exposure.

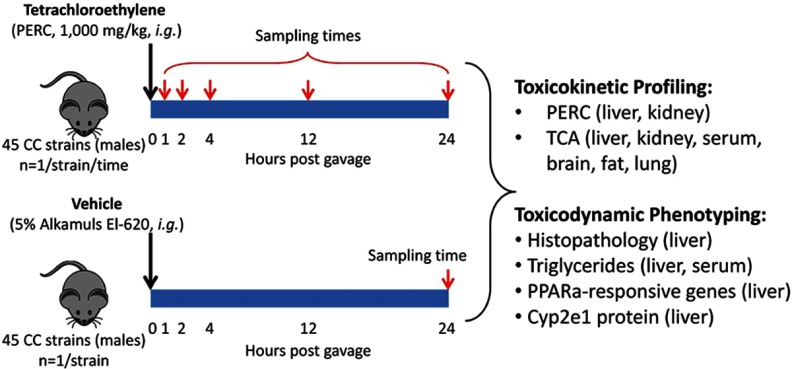
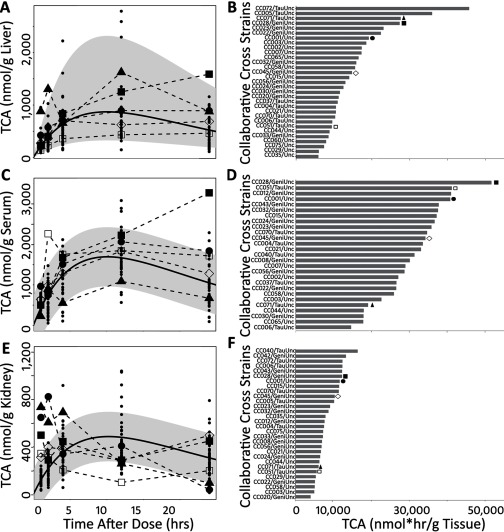
Methods: Male mice from 45 strains of the Collaborative Cross (CC) were orally administered a single dose of PERC (1,000 mg/kg) or vehicle (Alkamuls-EL620) and euthanized at various time points (n = 1/strain/time). Concentration–time profiles were generated for PERC and its primary oxidative metabolite trichloroacetate (TCA) in multiple tissues. Toxicodynamic phenotyping was also performed.

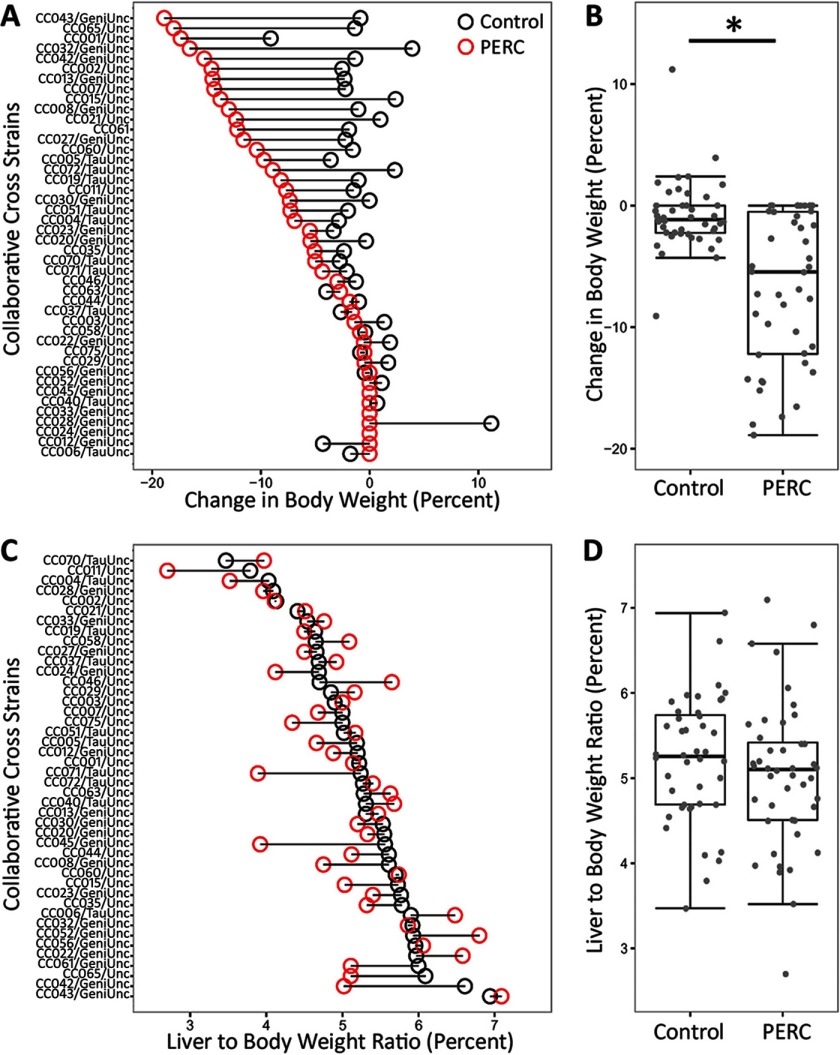
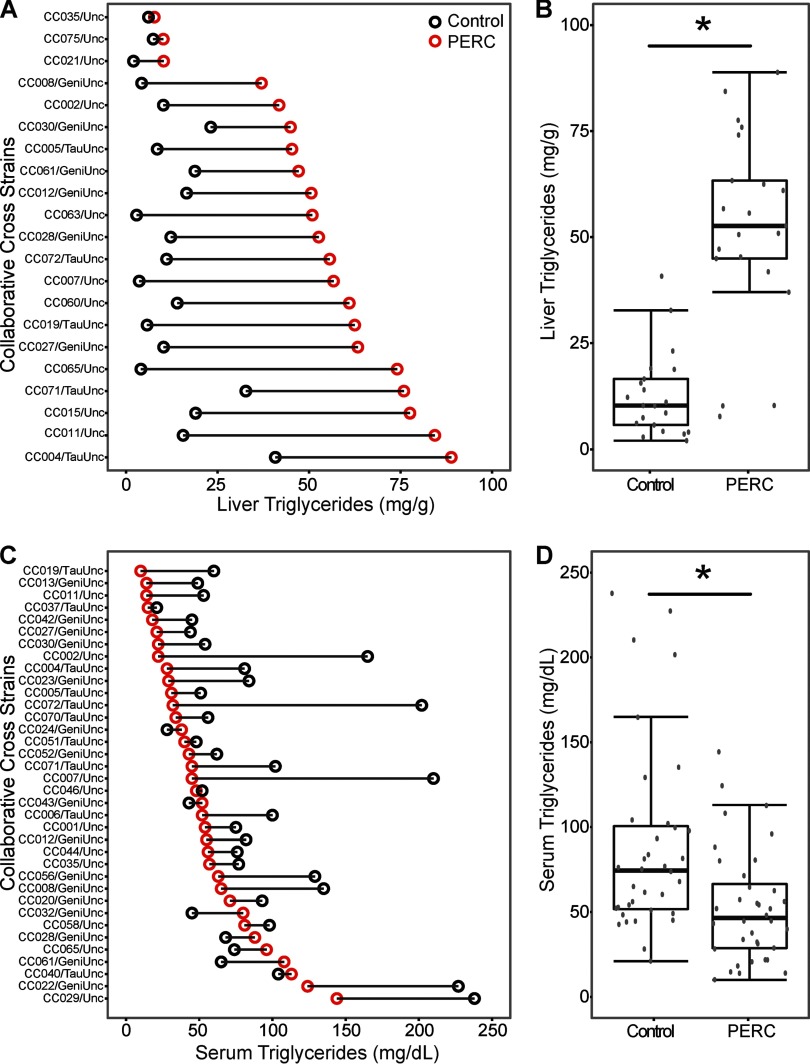
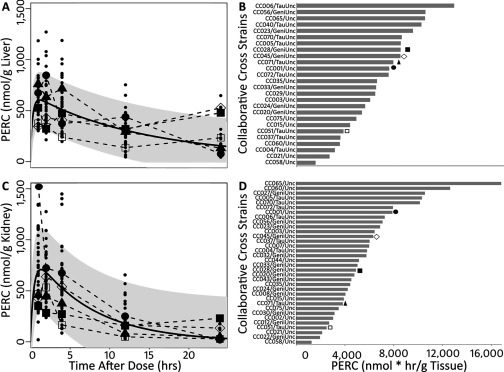
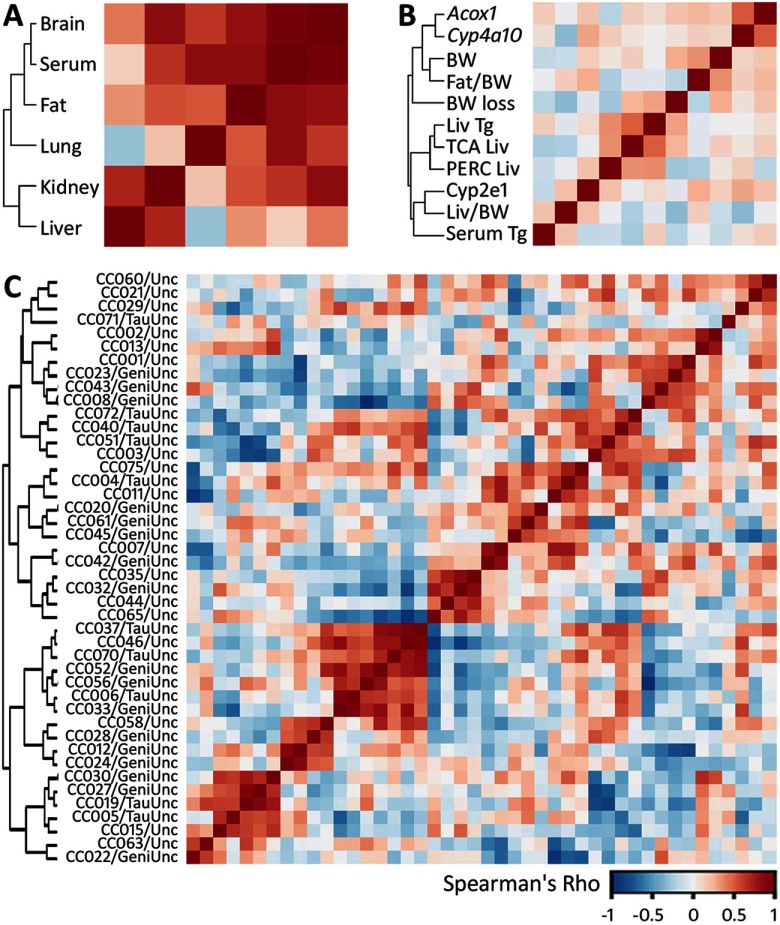
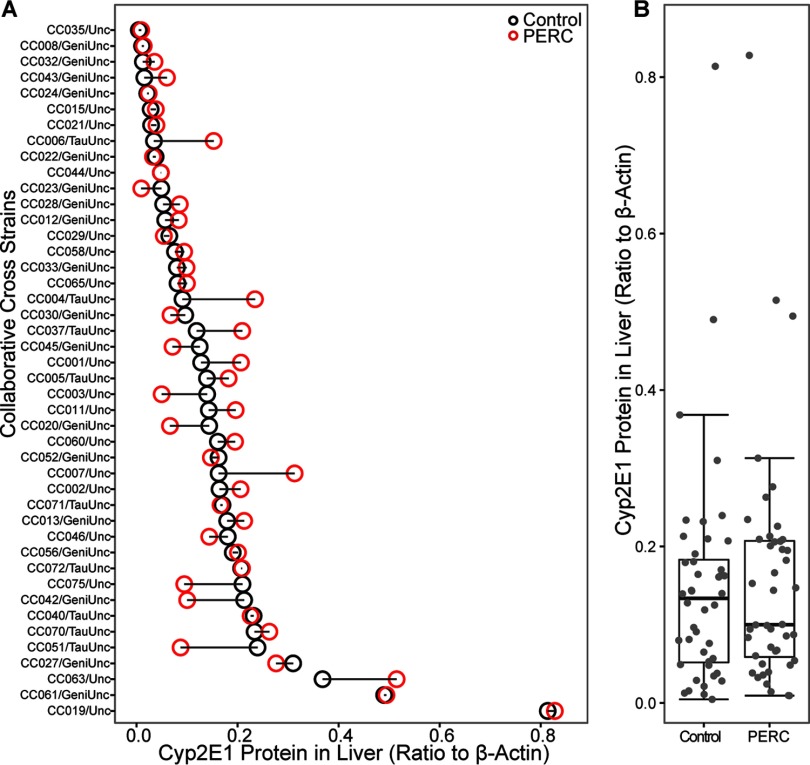
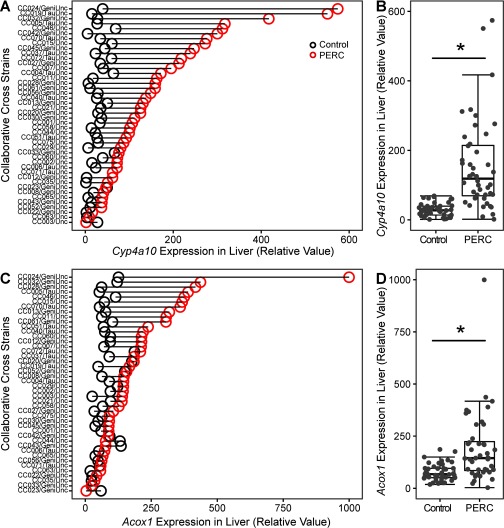
Results: Significant variability among strains was observed in toxicokinetics of PERC and TCA in every tissue examined. Based on area under the curve (AUC), the range of liver TCA levels spanned nearly an order of magnitude (~8-fold). Expression of liver cytochrome P4502E1 did not correlate with TCA levels. Toxicodynamic phenotyping revealed an effect of PERC on bodyweight loss, induction of peroxisome proliferator activated receptor-alpha (PPARα)-regulated genes, and dysregulation of hepatic lipid homeostasis. Clustering was observed among a) liver levels of PERC, TCA, and triglycerides; b) TCA levels in liver and kidney; and c) TCA levels in serum, brain, fat, and lung.

Conclusions: Using the CC mouse population model, we have demonstrated a complex and highly variable relationship between PERC and TCA toxicokinetics and toxicodynamics at the population level. https://doi.org/10.1289/EHP788.


Figures

Conceptual diagram.
Figure 1.
Study design consisted of two groups (PERC and vehicle) and five time points (1, 2, 4, 12, and 24 hr postdosing).
Panels A and C are graphical representations indicating collaborative cross strains (y-axis) across change in body weight in percentage, and liver to body weight ratio in percentage, respectively (x-axis) for control and PERC-treated mice. Panels B and D are box-and-whisker plots indicating change in body weight in percentage and liver to body weight ratio in percentage, respectively (y-axis) for control and PERC-treated mice (x-axis).
Figure 2.
Relative change in bodyweight (A,B) and liver to body weight ratio (C,D), as compared to pre-treatment weight, in vehicle- (black dot) and PERC- (1,000mg/kg, i.g., red dot) exposed Collaborative Cross mice 24 hr following a single intragastric gavage. A and C show change in the individual strains that were ordered according to the change in body weight in PERC-treated mice (A), or liver to body weight ratio in vehicle-treated mice (C). B and D show population averages as box and whisker plots. The box represents the interquartile range (IQR), the black line represents the median, and the whiskers represent Q1-1.5*IQR and Q3+1.5*IQR. The asterisk (*) denotes significant difference (p<0.05) between treatment groups (unpaired t-test).
Panels A and C are graphical representations indicating collaborative cross strains (y-axis) across liver triglycerides in milligrams per gram and serum triglycerides in milligrams per deciliter (x-axis), respectively, for control and PERC-treated mice. Panels B and D are box-and-whisker plots indicating liver triglycerides in milligrams per gram and serum triglycerides in milligrams per deciliter (y-axis), respectively, for control and PERC-treated mice (x-axis).
Figure 3.
Differences in liver (A,B) and serum (C,D) triglyceride levels in vehicle- (black dot) and PERC- (1,000mg/kg, i.g., red dot) exposed Collaborative Cross mice 24 hr following a single intragastric gavage. A and C show change in the individual strains that were ordered according to the values in PERC-treated mice. B and D show population averages as box and whisker plots (see Figure 2 for the legend). The asterisks (*) denote significant differences (p<0.05) between treatment groups (unpaired t-test).
Panels A and C are graphical representations indicating concentration of PERC in nanomolar per gram for liver and kidney (y-axis), respectively, across time after dosage in hours (x-axis). Panels B and D are panels of bar graphs indicating collaborative cross strains (y-axis) across concentration of PERC in nanomolar times hour per gram of tissue (x-axis).
Figure 4.
Concentration–time profiles of PERC in liver (A) and kidney (C) following a single oral dose of PERC (1,000mg/kg). The black solid line and gray shadowing represent a fitted nonlinear least square regression line and 95% confidence interval (respectively) for the entire data set. Dots represent data from the individual animals. Some strains are highlighted by using enlarged symbols. B and D represent calculated AUCs for strains in which a full concentration–time profile was available (i.e., n=1mouse/timepoint). The symbols in A and C are coordinated (by strain) with the symbols above the bars in B and D.
Panels A, C, and E graphical representations indicating concentration of TCA in nanomolar per gram for liver, serum, and kidney (y-axis), respectively, across time after dosage in hours (x-axis). Panels B, D, and F are panels of bar graphs indicating collaborative cross strains (y-axis) across concentration of TCA in nanomolar times hour per gram of tissue (x-axis).
Figure 5.
Concentration–time profiles of TCA in liver (A), serum (C), and kidney (E) following a single oral dose of PERC (1,000mg/kg). The black solid line and gray shadowing represent a fitted nonlinear least square regression line and 95% confidence interval (respectively) for the entire data set. Dots represent data from the individual animals. Some strains are highlighted by using enlarged symbols. B, D, and F represent calculated AUCs for strains in which a full concentration–time profile was available (i.e., n=1mouse/timepoint). The symbols in A, C, and E are coordinated (by strain) with the symbols above the bars in B, D, and F.
Correlation matrices.
Figure 6.
Correlation matrices (colored according to the value of pairwise Spearman’s correlation for the phenotypes included in each analysis; see color bar scale) for toxicokinetic and toxicodynamic phenotypes across the population of Collaborative Cross strains. Unsupervised hierarchical clustering among parameters is shown by the dendrogram. (A) Heatmap of TCA partial AUCs (0–24 hr) in multiple tissues from a subset of nine strains of the Collaborative Cross treated with a single dose of 1,000mg/kg PERC (see Figure S2 for concentration–time profiles). (B) Heatmap of toxicodynamic and toxicokinetic responses to PERC across the population. Abbreviations: Acox1 and Cyp4a10 = induction of Acox1 and Cyp4a10 after PERC exposure; BW = basal bodyweight; Fat/BW = fat-to-bodyweight ratio; BW loss = loss of bodyweight after PERC exposure, percent; Liv Tg = liver triglycerides following PERC exposure; TCA Liv= TCA AUC in liver; PERC Liv = PERC AUC in liver; CYP2E1 = liver CYP2E1 levels in vehicle-treated mice; Liv/BW = liver-to-bodyweight ratio after PERC treatment; Serum TG = serum triglyceride levels after PERC treatment. For all phenotypic parameters except for metabolite data, values were normalized to vehicle-treated strain-matched controls. (C) Heatmap of correlations among strains based on the phenotypes shown in B.
Panel A is a graphical representation indicating collaborative cross strains (y-axis) across concentration of CYP2E1 protein in liver (ratio to beta actin) (x-axis). Panel B is a box-and-whisker plot indicating concentration of CYP2E1 protein in liver (ratio to beta actin) (y-axis) for control and PERC-treated mice (x-axis).
Figure 7.
Liver levels of CYP2E1 protein in vehicle- (black dot) and PERC- (1,000mg/kg, i.g., red dot) exposed Collaborative Cross mice 24 hr following a single intragastric gavage. A shows change in the individual strains that were ordered according to the values in vehicle-treated mice. B shows population average as box and whisker plots (see Figure 2 for the legend).
Panels A and C are line graphs indicating collaborative cross strains (y-axis) across Cyp4a10 and Acox1 expression in liver separately (relative value) (x-axis). Panels B and D are box-and-whisker plots indicating Cyp4a10 and Acox1 expression in liver separately (relative value) (y-axis) for control and PERC-treated mice (x-axis).
Figure 8.
Differences in expression of Cyp4a10 (A,B) and Acox1 (C,D) in the liver of vehicle- (black dot) and PERC- (1,000mg/kg, i.g., red dot) exposed Collaborative Cross mice 24 hr following a single intragastric gavage. A and C show change in the individual strains that were ordered according to the values in PERC-treated mice. B and D show population averages as box and whisker plots (see Figure 2 for the legend). The asterisks (*) denote significant differences (p<0.05)between treatment groups (unpaired t-test).

Comment in

References

    1. Bois FY, Gelman A, Jiang J, Maszle DR, Zeise L, Alexeef G. 1996. Population toxicokinetics of tetrachloroethylene. Arch Toxicol 70:347–355, PMID: 8975633, 10.1007/s002040050284. - DOI - PubMed
    1. Bradford BU, Lock EF, Kosyk O, Kim S, Uehara T, Harbourt D, et al. 2011. Interstrain differences in the liver effects of trichloroethylene in a multistrain panel of inbred mice. Toxicol Sci 120:206–217, PMID: 21135412, 10.1093/toxsci/kfq362. - DOI - PMC - PubMed
    1. Buben JA, O'Flaherty EJ. 1985. Delineation of the role of metabolism in the hepatotoxicity of trichloroethylene and perchloroethylene: a dose-effect study. Toxicol Appl Pharmacol 78:105–122, PMID: 2994252. - PubMed
    1. Chiu WA, Campbell JL Jr, Clewell HJ III, Zhou YH, Wright FA, Guyton KZ, et al. 2014. Physiologically based pharmacokinetic (PBPK) modeling of interstrain variability in trichloroethylene metabolism in the mouse. Environ Health Perspect 122:456–463, PMID: 24518055, 10.1289/ehp.1307623. - DOI - PMC - PubMed
    1. Chiu WA, Ginsberg GL. 2011. Development and evaluation of a harmonized physiologically based pharmacokinetic (PBPK) model for perchloroethylene toxicokinetics in mice, rats, and humans. Toxicol Appl Pharmacol 253:203–234, PMID: 21466818, 10.1016/j.taap.2011.03.020. - DOI - PubMed

LinkOut - more resources