Oncopig Soft-Tissue Sarcomas Recapitulate Key Transcriptional Features of Human Sarcomas
- PMID: 28572589
- PMCID: PMC5453942
- DOI: 10.1038/s41598-017-02912-9
Oncopig Soft-Tissue Sarcomas Recapitulate Key Transcriptional Features of Human Sarcomas
Abstract
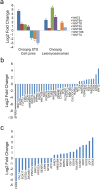
Human soft-tissue sarcomas (STS) are rare mesenchymal tumors with a 5-year survival rate of 50%, highlighting the need for further STS research. Research has been hampered by limited human sarcoma cell line availability and the large number of STS subtypes, making development of STS cell lines and animal models representative of the diverse human STS subtypes critical. Pigs represent ideal human disease models due to their similar size, anatomy, metabolism, and genetics compared to humans. The Oncopig encodes inducible KRAS G12D and TP53 R167H transgenes, allowing for STS modeling in a spatial and temporal manner. This study utilized Oncopig STS cell line (fibroblast) and tumor (leiomyosarcoma) RNA-seq data to compare Oncopig and human STS expression profiles. Altered expression of 3,360 and 7,652 genes was identified in Oncopig STS cell lines and leiomyosarcomas, respectively. Transcriptional hallmarks of human STS were observed in Oncopig STS, including altered TP53 signaling, Wnt signaling activation, and evidence of epigenetic reprogramming. Furthermore, master regulators of Oncopig STS expression were identified, including FOSL1, which was previously identified as a potential human STS therapeutic target. These results demonstrate the Oncopig STS model's ability to mimic human STS transcriptional profiles, providing a valuable resource for sarcoma research and cell line development.
Conflict of interest statement
The authors declare that they have no competing interests.
Figures


Similar articles
-
miR-152 down-regulation is associated with MET up-regulation in leiomyosarcoma and undifferentiated pleomorphic sarcoma.Cell Oncol (Dordr). 2017 Feb;40(1):77-88. doi: 10.1007/s13402-016-0306-4. Epub 2016 Nov 29. Cell Oncol (Dordr). 2017. PMID: 27900663
-
Dual Pten/Tp53 suppression promotes sarcoma progression by activating Notch signaling.Am J Pathol. 2013 Jun;182(6):2015-27. doi: 10.1016/j.ajpath.2013.02.035. Am J Pathol. 2013. PMID: 23708211 Free PMC article.
-
Establishment and molecular characterisation of seven novel soft-tissue sarcoma cell lines.Br J Cancer. 2016 Oct 25;115(9):1058-1068. doi: 10.1038/bjc.2016.259. Epub 2016 Aug 25. Br J Cancer. 2016. PMID: 27560552 Free PMC article.
-
Laboratory investigation, genetics, and experimental models in sarcomas.Curr Opin Oncol. 1991 Aug;3(4):665-70. Curr Opin Oncol. 1991. PMID: 1932225 Review.
-
Lessons from genetic profiling in soft tissue sarcomas.Acta Orthop Scand Suppl. 2004 Apr;75(311):35-50. doi: 10.1080/00016470410001708310. Acta Orthop Scand Suppl. 2004. PMID: 15188664 Review.
Cited by
-
The CRISPR/Cas9 Minipig-A Transgenic Minipig to Produce Specific Mutations in Designated Tissues.Cancers (Basel). 2021 Jun 16;13(12):3024. doi: 10.3390/cancers13123024. Cancers (Basel). 2021. PMID: 34208747 Free PMC article.
-
Oncopig bladder cancer cells recapitulate human bladder cancer treatment responses in vitro.Front Oncol. 2024 Feb 26;14:1323422. doi: 10.3389/fonc.2024.1323422. eCollection 2024. Front Oncol. 2024. PMID: 38469237 Free PMC article.
-
The Oncopig Cancer Model as a Complementary Tool for Phenotypic Drug Discovery.Front Pharmacol. 2017 Dec 5;8:894. doi: 10.3389/fphar.2017.00894. eCollection 2017. Front Pharmacol. 2017. PMID: 29259556 Free PMC article. Review.
-
Perspective: Humanized Pig Models of Bladder Cancer.Front Mol Biosci. 2021 May 17;8:681044. doi: 10.3389/fmolb.2021.681044. eCollection 2021. Front Mol Biosci. 2021. PMID: 34079821 Free PMC article.
-
Non-murine models to investigate tumor-immune interactions in head and neck cancer.Oncogene. 2019 Jun;38(25):4902-4914. doi: 10.1038/s41388-019-0776-8. Epub 2019 Mar 14. Oncogene. 2019. PMID: 30872793 Free PMC article. Review.
References
-
- Bedi M, et al. Localized Management of Soft Tissue Sarcoma Metastasis: A Review of a Multidisciplinary Approach. Cancer Res. Front. 2015;1:162–171. doi: 10.17980/2015.162. - DOI
Publication types
MeSH terms
LinkOut - more resources
Full Text Sources
Other Literature Sources
Medical
Research Materials
Miscellaneous

