. 2017 Jun 1;7(1):2594.
doi: 10.1038/s41598-017-02995-4.

Fiber-utilizing capacity varies in Prevotella- versus Bacteroides-dominated gut microbiota

Affiliations

Fiber-utilizing capacity varies in Prevotella- versus Bacteroides-dominated gut microbiota

Tingting Chen et al. Sci Rep. .

Abstract

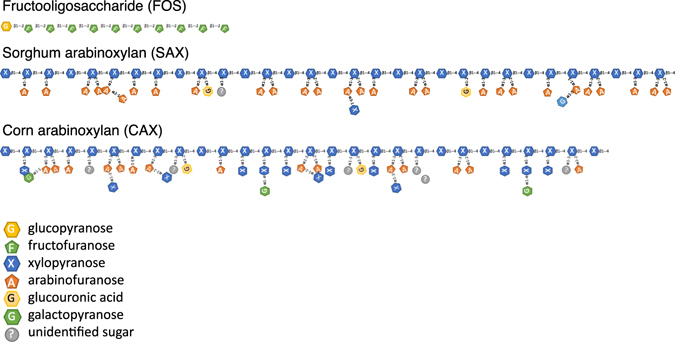
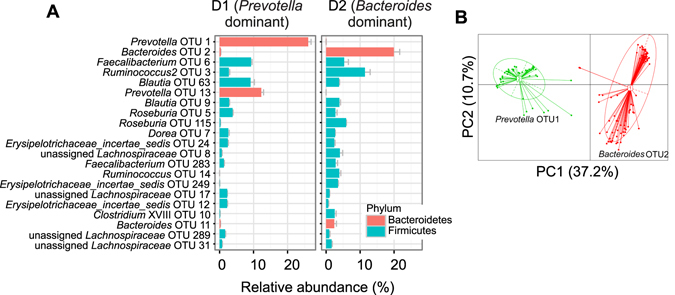
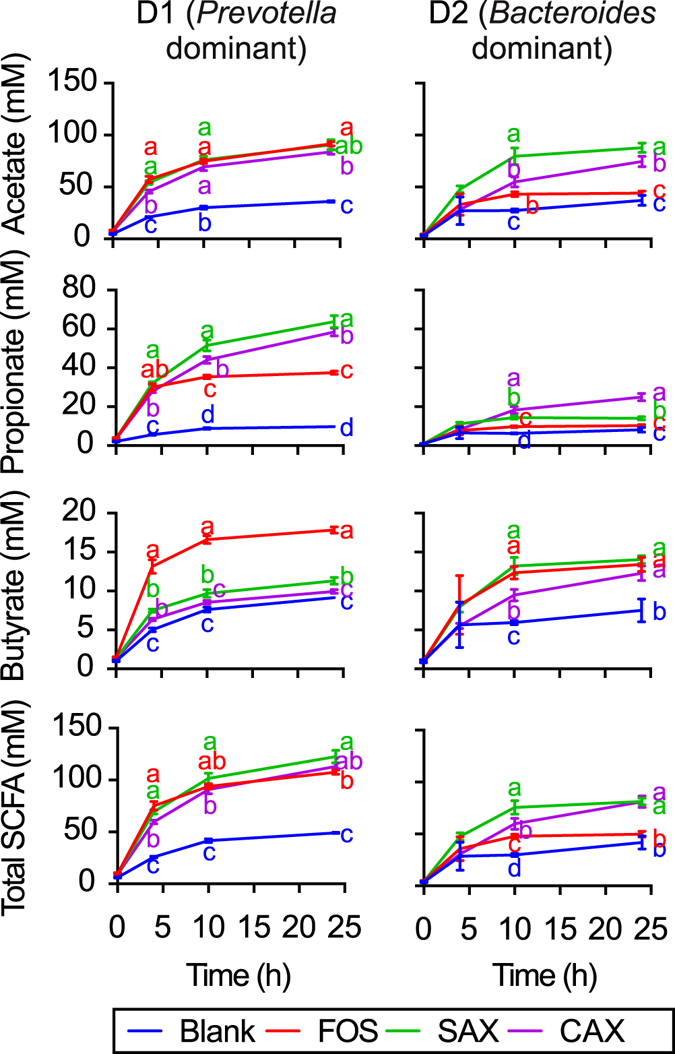
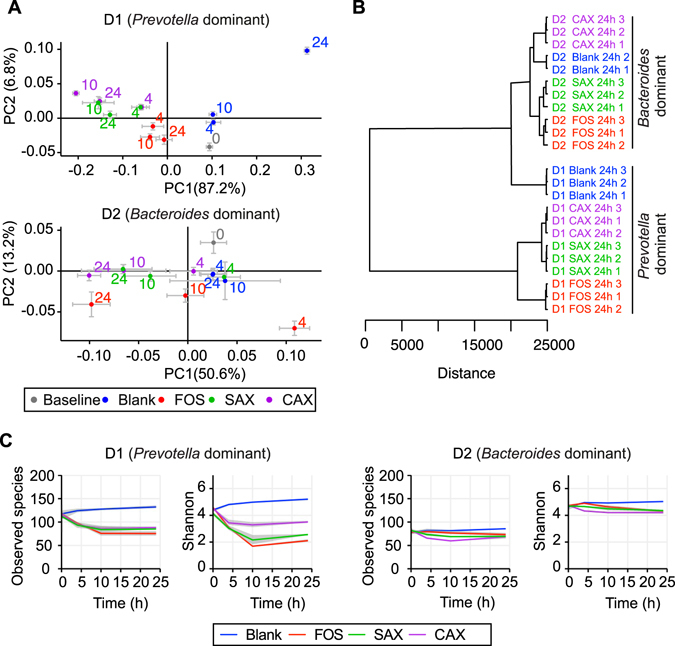
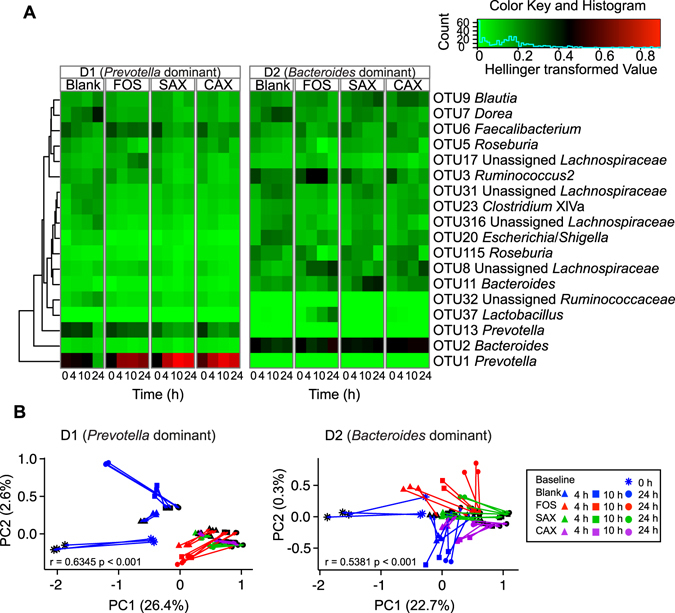
The gut microbiota of individuals are dominated by different fiber-utilizing bacteria, which ferment dietary fiber into short chain fatty acids (SCFAs) known to be important for human health. Here, we show that the dominance of Prevotella versus Bacteroides in fecal innocula, identified into two different enterotypes, differentially impacts in vitro fermentation profiles of SCFAs from fibers with different chemical structures. In a microbiome of the Prevotella enterotype, fructooligosaccharides, and sorghum and corn arabinoxylans significantly promoted one single Prevotella OTU with equally high production of total SCFAs with propionate as the major product. Conversely, in the Bacteroides-dominated microbiota, the three fibers enriched different OTUs leading to different levels and ratios of SCFAs. This is the first report showing how individual differences in two enterotypes cause distinctly different responses to dietary fiber. Microbiota dominated by different fiber-utilizing bacteria may impact host health by way of producing different amounts and profiles of SCFAs from the same carbohydrate substrates.


Conflict of interest statement

Ms. Chen’s research assistantship was supported by Nutrabiotix Inc., through a SBIR-NIH grant; and Dr. Hamaker is a partner of Nutrabiotix, Inc. There was no intellectual property derived from this study. Other authors declare no conflict of interest.

Figures

Figure 1
Figure 1
Illustration of the fiber structures of fructooligosaccharides (FOS), sorghum arabinoxylan (SAX), and corn arabinoxylan (CAX).
Figure 2
Figure 2
Fecal sample microbiota compositions for D1 and D2. (A) Relative abundance of OTUs with abundance larger than 1% in at least one sample. (B) Clustering of microbiota from D1 and D2 together with 54 healthy subjects shows their alignment with Prevotella and Bacteroides enterotypes, respectively.
Figure 3
Figure 3
Short chain fatty acid (SCFA) in vitro fermentation products in D1 and D2 when fed fructooligosaccharides (FOS), sorghum arabinoxylan (SAX), and corn arabinoxylan (CAX). Different letters indicate significant differences in SCFAs among fiber treatments at the same time point (α = 0.05).
Figure 4
Figure 4
Microbiota composition shift for D1 and D2 over the 24 h fermentation. (A) PCoA plot of jackknifed weighted UniFrac distance within the bacteria community shift under different treatments and times. Numbers by the symbols indicate fermentation time (h). Mean values ± SD are plotted. (B) Dissimilarity of microbiota after 24 h fermentation with each fiber. Samples were clustered using the Ward agglomerative algorithm on Euclidean distances. Distances were calculated using arbitrary units. (C) Observed species and Shannon diversity change over time.
Figure 5
Figure 5
Microbiota shifts during fermentation and correlation with SCFA production. (A) Heatmap of the shift in key OTUs during fermentation. Key OTUs picked out by RDA ordination biplot based on the Hellinger-transformed Euclidean distance among samples (Legendre et al.) and the eigenvalue of each OTU. The color of the heatmap from green to red represents the abundance of each OTU after the Hellinger transformation (square root of each OTU abundance divided by mean OTU abundance of each sample). Mean value of three replicates are plotted. (B) The Jaccard distance of SCFA compositions (end of lines with black symbols) to the microbiota compositions (end of lines with colored symbols) as superimposed by Procrustes. Two symbols connected by a line indicate two data sets from the same sample. P-values were calculated by PROTEST, p < 0.001 indicates significant concordance of the two PCoAs.

References

    1. Arumugam M, et al. Enterotypes of the human gut microbiome. Nature. 2011;473:174–180. doi: 10.1038/nature09944. - DOI - PMC - PubMed
    1. Wu GD, et al. Linking long-term dietary patterns with gut microbial enterotypes. Science. 2011;334:105–108. doi: 10.1126/science.1208344. - DOI - PMC - PubMed
    1. Lim MY, et al. Stability of gut enterotypes in Korean monozygotic twins and their association with biomarkers and diet. Sci. Rep. 2014;4:7348. doi: 10.1038/srep07348. - DOI - PMC - PubMed
    1. De Filippo C, et al. Impact of diet in shaping gut microbiota revealed by a comparative study in children from Europe and rural Africa. Proc. Natl. Acad. Sci. USA. 2010;107:14691–14696. doi: 10.1073/pnas.1005963107. - DOI - PMC - PubMed
    1. Schnorr SL, et al. Gut microbiome of the Hadza hunter-gatherers. Nat Commun. 2014;5:3654. doi: 10.1038/ncomms4654. - DOI - PMC - PubMed

Publication types