

Conversion Discriminative Analysis on Mild Cognitive Impairment Using Multiple Cortical Features from MR Images
- PMID: 28572766
- PMCID: PMC5435825
- DOI: 10.3389/fnagi.2017.00146
Conversion Discriminative Analysis on Mild Cognitive Impairment Using Multiple Cortical Features from MR Images
Erratum in
-
Corrigendum: Conversion Discriminative Analysis on Mild Cognitive Impairment Using Multiple Cortical Features from MR Images.Front Aging Neurosci. 2017 Sep 5;9:293. doi: 10.3389/fnagi.2017.00293. eCollection 2017. Front Aging Neurosci. 2017. PMID: 28900396 Free PMC article.
Abstract
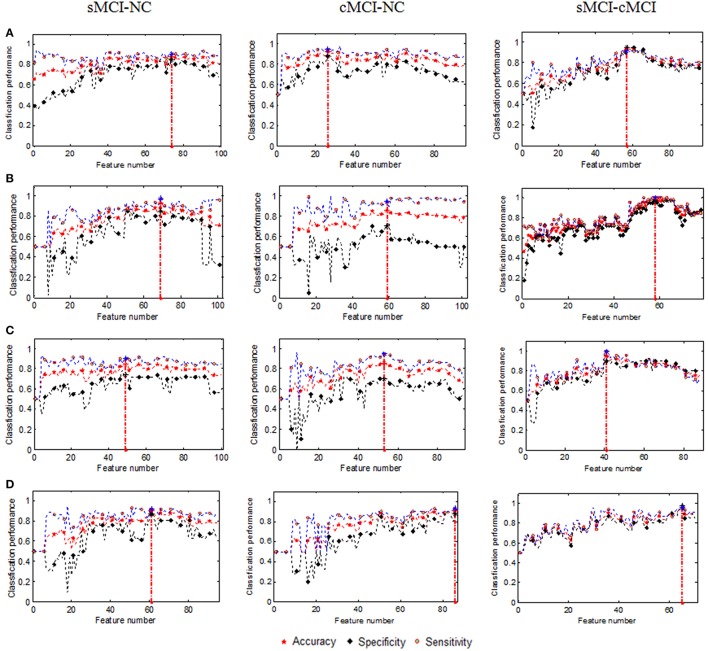
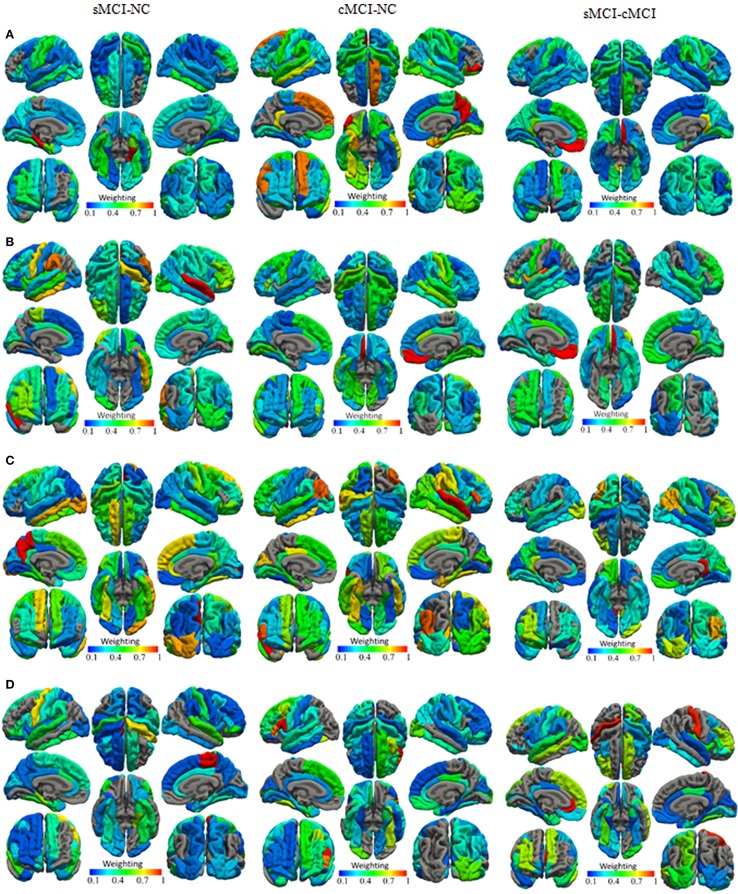
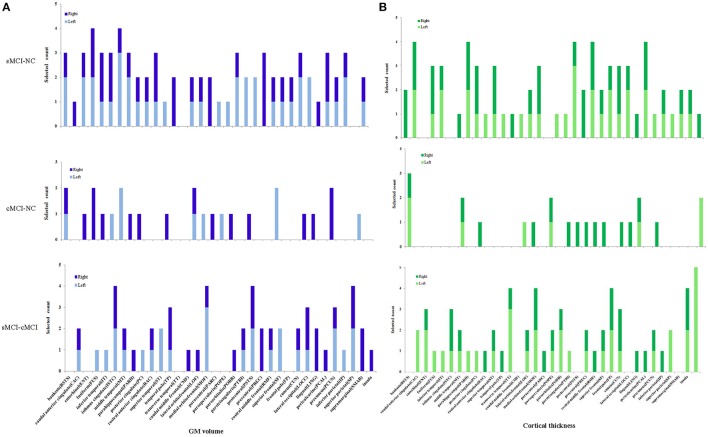
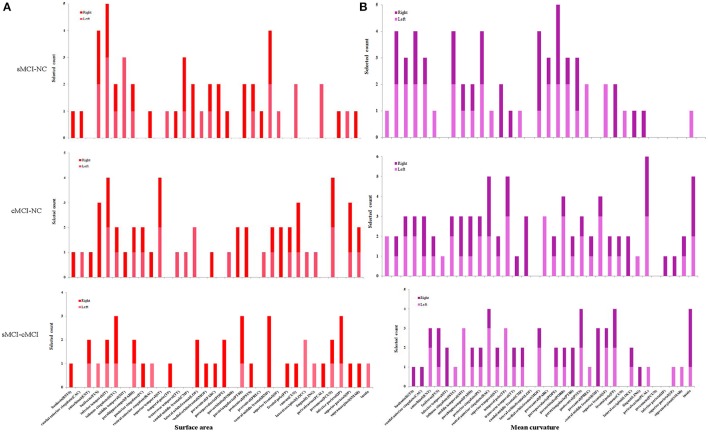
Neuroimaging measurements derived from magnetic resonance imaging provide important information required for detecting changes related to the progression of mild cognitive impairment (MCI). Cortical features and changes play a crucial role in revealing unique anatomical patterns of brain regions, and further differentiate MCI patients from normal states. Four cortical features, namely, gray matter volume, cortical thickness, surface area, and mean curvature, were explored for discriminative analysis among three groups including the stable MCI (sMCI), the converted MCI (cMCI), and the normal control (NC) groups. In this study, 158 subjects (72 NC, 46 sMCI, and 40 cMCI) were selected from the Alzheimer's Disease Neuroimaging Initiative. A sparse-constrained regression model based on the l2-1-norm was introduced to reduce the feature dimensionality and retrieve essential features for the discrimination of the three groups by using a support vector machine (SVM). An optimized strategy of feature addition based on the weight of each feature was adopted for the SVM classifier in order to achieve the best classification performance. The baseline cortical features combined with the longitudinal measurements for 2 years of follow-up data yielded prominent classification results. In particular, the cortical thickness produced a classification with 98.84% accuracy, 97.5% sensitivity, and 100% specificity for the sMCI-cMCI comparison; 92.37% accuracy, 84.78% sensitivity, and 97.22% specificity for the cMCI-NC comparison; and 93.75% accuracy, 92.5% sensitivity, and 94.44% specificity for the sMCI-NC comparison. The best performances obtained by the SVM classifier using the essential features were 5-40% more than those using all of the retained features. The feasibility of the cortical features for the recognition of anatomical patterns was certified; thus, the proposed method has the potential to improve the clinical diagnosis of sub-types of MCI and predict the risk of its conversion to Alzheimer's disease.
Keywords: classification; conversion; cortical feature; feature reduction; mild cognitive impairment; sparse-constrained regression.
Figures
References
Grants and funding
LinkOut - more resources
Full Text Sources
Other Literature Sources