

Drug delivery in a tumour cord model: a computational simulation
- PMID: 28573005
- PMCID: PMC5451806
- DOI: 10.1098/rsos.170014
Drug delivery in a tumour cord model: a computational simulation
Abstract
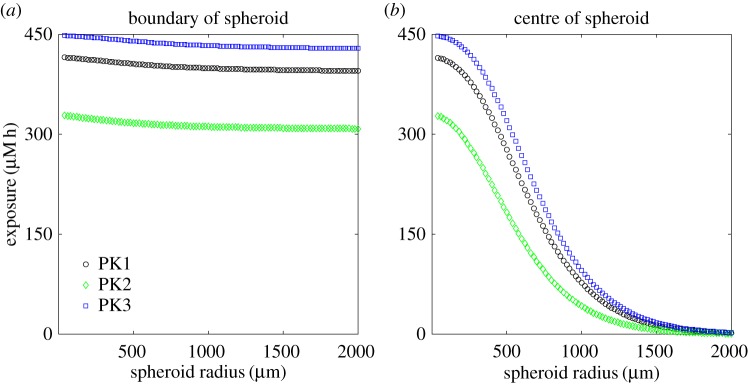
The tumour vasculature and microenvironment is complex and heterogeneous, contributing to reduced delivery of cancer drugs to the tumour. We have developed an in silico model of drug transport in a tumour cord to explore the effect of different drug regimes over a 72 h period and how changes in pharmacokinetic parameters affect tumour exposure to the cytotoxic drug doxorubicin. We used the model to describe the radial and axial distribution of drug in the tumour cord as a function of changes in the transport rate across the cell membrane, blood vessel and intercellular permeability, flow rate, and the binding and unbinding ratio of drug within the cancer cells. We explored how changes in these parameters may affect cellular exposure to drug. The model demonstrates the extent to which distance from the supplying vessel influences drug levels and the effect of dosing schedule in relation to saturation of drug-binding sites. It also shows the likely impact on drug distribution of the aberrant vasculature seen within tumours. The model can be adapted for other drugs and extended to include other parameters. The analysis confirms that computational models can play a role in understanding novel cancer therapies to optimize drug administration and delivery.
Keywords: computational modelling; drug delivery; drug transport and binding; mathematical modelling; pharmacokinetic resistance.
Conflict of interest statement
The authors declare no competing interests.
Figures


Similar articles
-
Mathematical and computational models of drug transport in tumours.J R Soc Interface. 2014 Mar 12;11(94):20131173. doi: 10.1098/rsif.2013.1173. Print 2014 May 6. J R Soc Interface. 2014. PMID: 24621814 Free PMC article.
-
In-silico dynamic analysis of cytotoxic drug administration to solid tumours: Effect of binding affinity and vessel permeability.PLoS Comput Biol. 2018 Oct 8;14(10):e1006460. doi: 10.1371/journal.pcbi.1006460. eCollection 2018 Oct. PLoS Comput Biol. 2018. PMID: 30296260 Free PMC article.
-
The influence of tumour vasculature on fluid flow in solid tumours: a mathematical modelling study.Biophys Rep. 2021 Feb 28;7(1):35-54. doi: 10.52601/bpr.2021.200041. Biophys Rep. 2021. PMID: 37288083 Free PMC article.
-
Computational modelling of drug delivery to solid tumour: Understanding the interplay between chemotherapeutics and biological system for optimised delivery systems.Adv Drug Deliv Rev. 2018 Jul;132:81-103. doi: 10.1016/j.addr.2018.07.013. Epub 2018 Jul 29. Adv Drug Deliv Rev. 2018. PMID: 30059703 Review.
-
Liposomal Formulations to Modulate the Tumour Microenvironment and Antitumour Immune Response.Int J Mol Sci. 2018 Sep 26;19(10):2922. doi: 10.3390/ijms19102922. Int J Mol Sci. 2018. PMID: 30261606 Free PMC article. Review.
Cited by
-
In silico study about the influence of electroporation parameters on the cellular internalization, spatial uniformity, and cytotoxic effects of chemotherapeutic drugs using the Method of Fundamental Solutions.Med Biol Eng Comput. 2024 Mar;62(3):713-749. doi: 10.1007/s11517-023-02964-2. Epub 2023 Nov 21. Med Biol Eng Comput. 2024. PMID: 37989990
-
In-silico tool based on Boolean networks and meshless simulations for prediction of reaction and transport mechanisms in the systemic administration of chemotherapeutic drugs.PLoS One. 2025 Feb 7;20(2):e0315194. doi: 10.1371/journal.pone.0315194. eCollection 2025. PLoS One. 2025. PMID: 39919263 Free PMC article.
-
Nanoconstructs for theranostic application in cancer: Challenges and strategies to enhance the delivery.Front Pharmacol. 2023 Mar 15;14:1101320. doi: 10.3389/fphar.2023.1101320. eCollection 2023. Front Pharmacol. 2023. PMID: 37007005 Free PMC article. Review.
-
Pore pressure evolution and mass loss of broken gangue during the seepage.R Soc Open Sci. 2018 Oct 10;5(10):180307. doi: 10.1098/rsos.180307. eCollection 2018 Oct. R Soc Open Sci. 2018. PMID: 30473808 Free PMC article.
-
Influence of electric field, blood velocity, and pharmacokinetics on electrochemotherapy efficiency.Biophys J. 2023 Aug 22;122(16):3268-3298. doi: 10.1016/j.bpj.2023.07.004. Epub 2023 Jul 7. Biophys J. 2023. PMID: 37421133 Free PMC article.
References
-
- Minchinton AI, Tannock IF. 2006. Drug penetration in solid tumours. Nat. Rev. Cancer 6, 583–592. (doi:10.1038/nrc1893) - DOI - PubMed
-
- Fuso Nerini I, Morosi L, Zucchetti M, Ballerini A, Giavazzi R, D’Incalci M. 2014. Intratumor heterogeneity and its impact on drug distribution and sensitivity. Clin. Pharmacol. Ther. 96, 224–238. (doi:10.1038/clpt.2014.105) - DOI - PubMed
-
- Tannock IF, Lee CM, Tunggal JK, Cowan DS, Egorin MJ. 2002. Limited penetration of anticancer drugs through tumor tissue: a potential cause of resistance of solid tumors to chemotherapy. Clin. Cancer Res. 8, 878–884. - PubMed
-
- Heldin C-H, Rubin K, Pietras K, Östman A. 2004. High interstitial fluid pressure: an obstacle in cancer therapy. Nat. Rev. Cancer 4, 806–813. (doi:10.1038/nrc1456) - DOI - PubMed
-
- Greulich P, Waclaw B, Allen RJ. 2012. Mutational pathway determines whether drug gradients accelerate evolution of drug-resistant cells. Phys. Rev. Lett. 109, 088101 (doi:10.1103/PhysRevLett.109.088101) - DOI - PubMed
Associated data
LinkOut - more resources
Full Text Sources
Other Literature Sources
