. 2017 Oct 6;18(19):2651-2657.
doi: 10.1002/cphc.201700450. Epub 2017 Jun 30.

Lipid Internal Dynamics Probed in Nanodiscs

Affiliations

Lipid Internal Dynamics Probed in Nanodiscs

Denis Martinez et al. Chemphyschem. .

Abstract

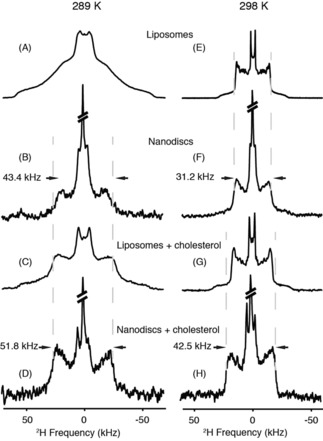
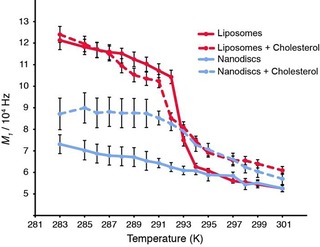
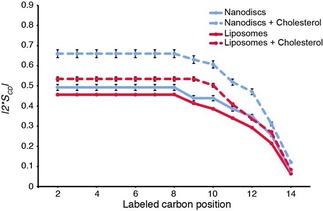
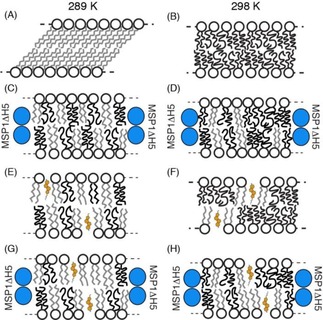
Nanodiscs offer a very promising tool to incorporate membrane proteins into native-like lipid bilayers and an alternative to liposomes to maintain protein functions and protein-lipid interactions in a soluble nanoscale object. The activity of the incorporated membrane protein appears to be correlated to its dynamics in the lipid bilayer and by protein-lipid interactions. These two parameters depend on the lipid internal dynamics surrounded by the lipid-encircling discoidal scaffold protein that might differ from more unrestricted lipid bilayers observed in vesicles or cellular extracts. A solid-state NMR spectroscopy investigation of lipid internal dynamics and thermotropism in nanodiscs is reported. The gel-to-fluid phase transition is almost abolished for nanodiscs, which maintain lipid fluid properties for a large temperature range. The addition of cholesterol allows fine-tuning of the internal bilayer dynamics by increasing chain ordering. Increased site-specific order parameters along the acyl chain reflect a higher internal ordering in nanodiscs compared with liposomes at room temperature; this is induced by the scaffold protein, which restricts lipid diffusion in the nanodisc area.

Keywords: NMR spectroscopy; lipids; membranes; nanostructures; solid-state structures.


Figures

Figure 1
Figure 1
Electron micrographs of: A) 1,2‐dimyristoyl‐sn‐glycero‐3‐phosphocholine (DMPC) MSP1ΔH5 nanodiscs (scale bar: 10 nm) and B) multilamellar DMPC liposomes (scale bar: 50 nm). A) The left column shows top views of the nanodiscs, whereas the right column shows side views of nanodiscs that are stacked on top of each other. Stacking arises from EM grid preparation and is a common feature of discoidal nanodiscs.5, 18
Figure 2
Figure 2
Wide‐line (static) 2H‐SSNMR spectra of deuterium‐labelled [D54]DMPC of various nanodisc and liposome assemblies acquired at 289 and 298 K. Spectra were recorded for samples in the absence (A and E, liposomes; B and F, nanodiscs) and in the presence of 7.5 % molar ratio cholesterol (C and G, liposomes; D and H, nanodiscs). Lorentzian line broadening of 300 (B, D, F and H) and 30 Hz (A, C, E, G) was applied before the Fourier transformation. The isotropic signal (5 % of the total signal) was cut to show the anisotropic contribution. Vertical dashed grey lines help to follow changes in spectral width.
Figure 3
Figure 3
Thermal variation of the first spectral moment (M 1) of [D54]DMPC, as determined from solid‐state 2H NMR spectra for liposomes (red) and nanodiscs (blue) in the presence (dashed lines) and absence (solid line) of cholesterol. Spectra have been acquired from 283 to 301 K and analysed with NMR‐DePaker [1.0rc1 software (Copyright (C) 2009 Sébastien Buchoux)] software to extract the M 1 value for each temperature.
Figure 4
Figure 4
C−2H order parameter as a function of labelled carbon position. Lipid ordering was determined at 298 K in nanodiscs (blue) and liposomes (red) and supplemented with cholesterol (dotted red and blue, respectively). Calculation of oriented‐like spectra from Pake patterns (De‐Pake‐ing) and simulation of 2H‐SSNMR spectra (E. Dufourc, in‐house program) were applied to measure individual quadrupolar splittings for [D54]DMPC and determine order parameters accurately. Error bars due to calculation procedures are estimated to be about 5 %.
Figure 5
Figure 5
Cartoons representing lipid dynamics at two temperatures (289 and 298 K) for liposome (A, B, E and F) and nanodisc (C, D, G and H) membrane systems. Different results obtained by solid‐state NMR spectroscopy for DMPC are summarised. The MSP1ΔH5 protein helices are represented as blue circles and acyl chain dynamics are indicated in black (for fast motions) and grey (for slow motions). Cholesterol is displayed in orange and the number of sterol molecules is in agreement with the DMPC/cholesterol molar ratio.

Similar articles

Cited by

References

    1. Arnold A., Labrot T., Oda R., Dufourc E. J., Biophys. J. 2002, 83, 2667–2680. - PMC - PubMed
    1. Bayburt T. H., Carlson J. W., Sligar S. G., J. Struct. Biol. 1998, 123, 37–44. - PubMed
    1. Bayburt T. H., Grinkova Y. V., Sligar S. G., Nano Lett. 2002, 2, 853–856.
    1. Bibow S., Carneiro M. G., Sabo T. M., Schwiegk C., Becker S., Riek R., Lee D., Protein Sci. 2014, 23, 851–856. - PMC - PubMed
    1. Bibow S., Polyhach Y., Eichmann C., Chi C. N., Kowal J., Albiez S., McLeod R. A., Stahlberg H., Jeschke G., Güntert P., Riek R., Nat. Struct. Mol. Biol. 2017, 24, 187–193. - PubMed