. 2017 Jul;6(7):1652-1664.
doi: 10.1002/cam4.1091. Epub 2017 Jun 1.

Overexpression of the human antigen R suppresses the immediate paradoxical proliferation of melanoma cell subpopulations in response to suboptimal BRAF inhibition

Affiliations

Overexpression of the human antigen R suppresses the immediate paradoxical proliferation of melanoma cell subpopulations in response to suboptimal BRAF inhibition

Marylise Fernandez et al. Cancer Med. 2017 Jul.

Abstract

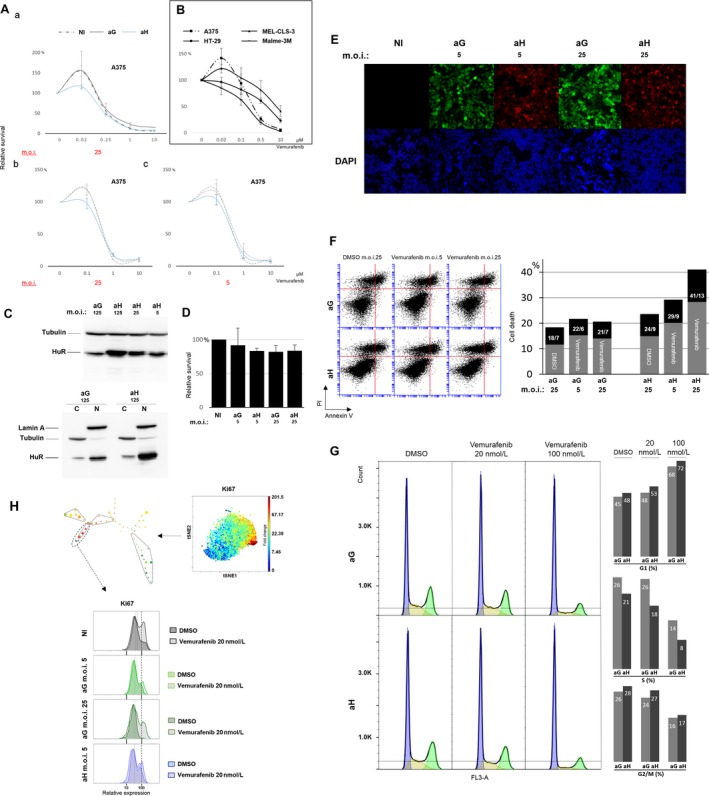
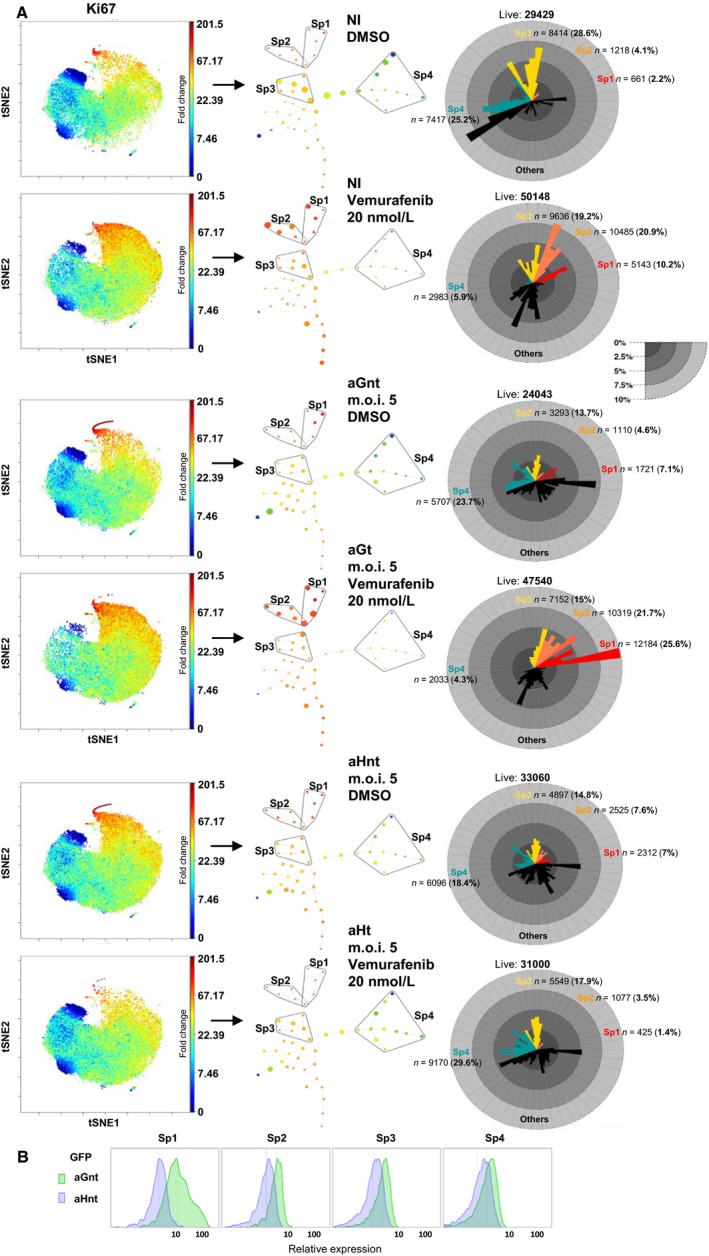
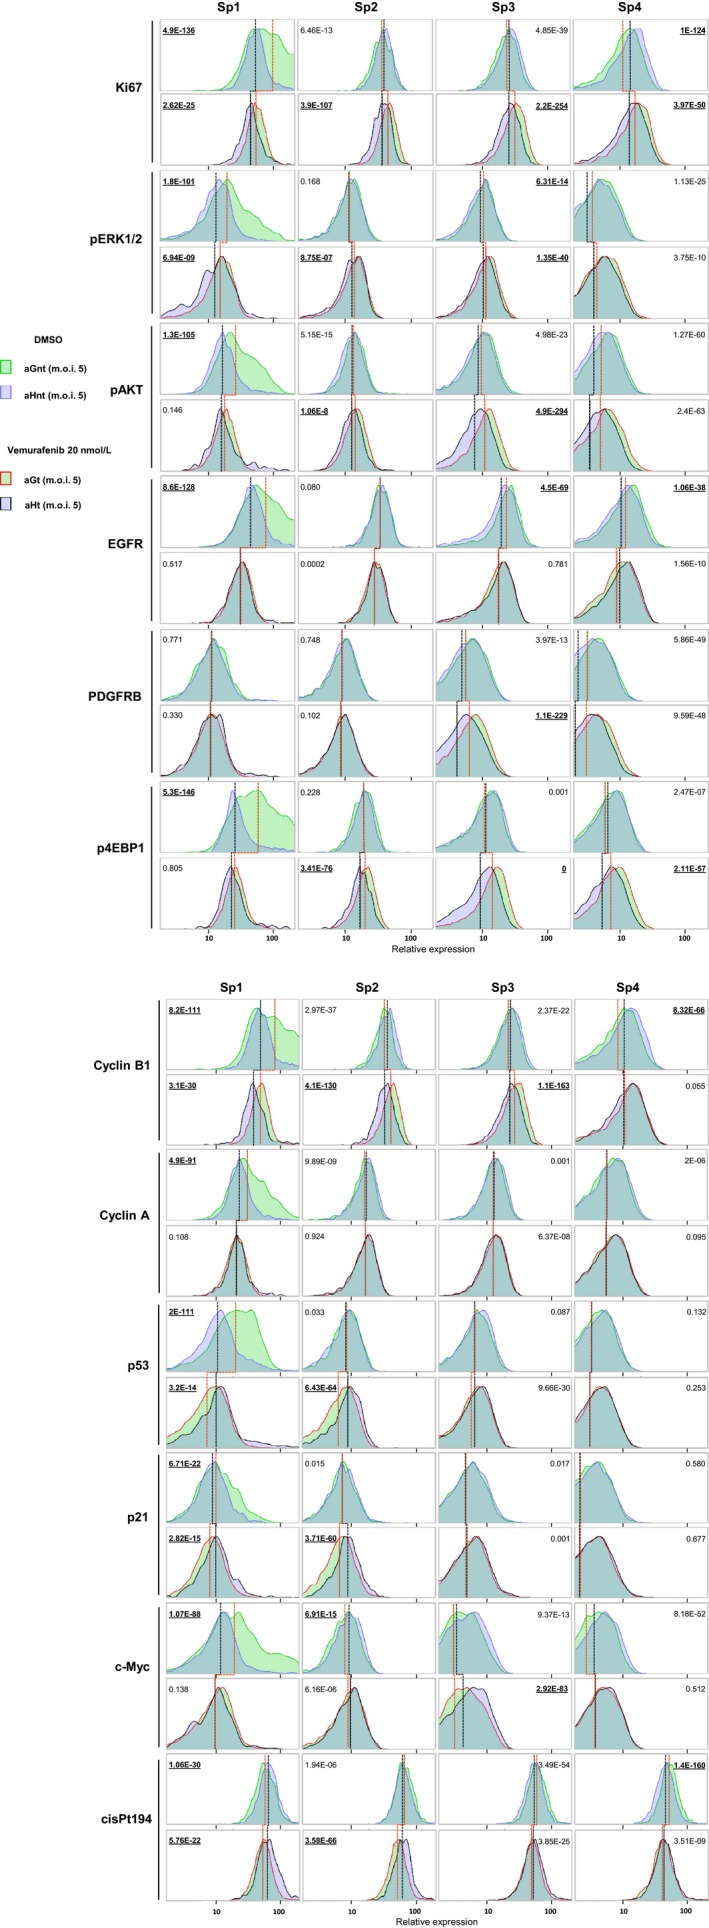
Tumor plasticity and the heterogeneous response of melanoma cells to targeted therapies are major limits for the long-term efficacy of this line of therapy. Targeting tumor plasticity is theoretically possible through the modulation of the expression of RNA-binding proteins which can affect many different compensatory mechanisms of the adaptive response of malignant cells to targeted therapies. Human antigen R (HuR) is a modulator of gene expression and a transacting factor in the mRNA-processing machinery used in the cell stress response, and is a potential target for reducing tumor plasticity. In this experiment, we exploit the inherent heterogeneous response of the A375 melanoma line to suboptimal BRAF inhibition as a model of immediate adaptive response. We first observe that HuR overexpression can prevent the heterogeneous response and thus the immediate paradoxical proliferation induced by low-doses vemurafenib treatment. We then use single-cell mass cytometry to characterize subpopulations, including those that paradoxically proliferate, based on their proliferation rate and the expression patterns of markers involved in the reversible adaptive resistance to BRAF inhibition and/or recognized as HuR targets involved in cell cycle regulation. Under suboptimal BRAF inhibition, HuR overexpression affects these subpopulations and their expression pattern with contrasting responses depending on their proliferation rate: faster-proliferating vemurafenib-sensitive or -resistant subpopulations showed higher death tendency and reduced size, and slower-proliferating subpopulations showed an attenuated resistant expression response and their paradoxical proliferation was inhibited. These observations pave the way to new therapeutic strategies for preventing the heterogeneous response of tumors to targeted therapies.

Keywords: BRAF inhibitor; RNA-binding protein HuR; cell heterogeneity; melanoma; single-cell mass cytometry; targeted therapy.


Figures

Figure 1
Figure 1
(A) Vemurafenib dose response of A375 cells comparing noninfected cells (NI, dotted line) with the control adenovirus expressing GFP (aG, gray line) or the T7 epitope‐tagged HuR adenovirus (aH, blue line) infected cells: a to b comparison indicates an inverse dose effect of vemurafenib on paradoxical proliferation. b to c comparison (performed in the same experiment) indicates a dose‐suppressive effect of HuR overexpression on paradoxical proliferation. (B) Vemurafenib dose response for various BRAFV600E‐sensitive melanoma cell lines (A375, Malme‐3M) and BRAFV600E‐resistant melanoma (MELCLS‐3) and colon carcinoma (HT‐29) cell lines: paradoxical proliferation is observed at low dose in A375 and to lower extend in MELCLS‐3 cells. (C) Top panel: Western blot analysis using a mouse monoclonal antibody (3A2) on A375 whole‐cell extracts infected with aG or aH at the indicated multiplicity of infection (m.o.i.). Bottom panel: Western blot analysis of HuR expression in A375 cytoplasmic (C) and nuclear (N) compartments following aG or aH infection (shown for the highest m.o.i. used). Note the slight tag‐induced shift in aH samples. An additional second upper band (tagged HuR) is clearly visible especially in cytoplasmic extracts in aH samples. (D) WST‐1 cell proliferation assay: at both indicated m.o.i. values, the proliferation rates of the aG‐ or aH‐infected A375 cells are not significantly affected compared with noninfected (NI) cells. (E) GFP fluorescence in aG‐infected cells and T7 epitope tag (Alexa 568) staining in aH‐infected cells at the indicated m.o.i.: more than 90% of the cells are stained homogenously even at the lower m.o.i. value. Cell nuclei were stained with DAPI (blue). Note that HuR (T7 epitope tag) stains primarily in the nucleus. (F) Cell death effects of HuR overexpression in low‐dose vemurafenib‐treated A375 melanoma cells: flow cytometry analysis of double‐stained (propidium iodide and Annexin V) A375 cells infected with aG or aH at the indicated m.o.i. and treated with either excipient (DMSO) or vemurafenib (100 nmol/L). A total of 25,000 events were analyzed for each sample. Black portion of the histograms represents the percentage of Annexin V‐positive cells within the percentage of dead cells (gray plus black). Their percentages are indicated in the black portion of the histograms. (G) A375 cells infected with aG and aH at m.o.i. 25 and treated with vemurafenib at the indicated concentrations were stained with propidium iodide for cell cycle analysis gated on live cells (blue: G1 phase, yellow: S phase, green: G2/M phase). Corresponding percentage of cells in each phase is indicated with histograms. (H) viSNE and SPADE single‐cell mass cytometry analysis of the Ki67 proliferation marker shown for noninfected (NI) excipient‐treated A375 cells. The color scale line gives an indication of the fold change in expression. For the Sp1 fast‐proliferating cells, the distribution of Ki67 expression is shown for NI cells (gray), aG cells (green, at the indicated m.o.i. values), and aH cells (blue). Hatched curves correspond to vemurafenib‐treated cells (20 nmol/L). Note that, although not detected in the initial proliferation assay (D), a small vector‐induced inhibitory effect is detectable in aG cells (at both m.o.i. values, compared with each other and to the NI cells). This inhibitory effect does not prevent the occurrence of paradoxical proliferation. The aH‐infected cells at m.o.i. 25 are not shown (See Fig. 2 legend). The dashed line helps the comparison.
Figure 2
Figure 2
(A) Mass cytometry analysis of the low‐dose vemurafenib‐induced paradoxical proliferation and its suppression in HuR‐overexpressing A375 cells: viSNE maps for NI excipient‐ (DMSO) and vemurafenib‐treated cells, aG (m.o.i. 5) excipient‐ (aGnt) and vemurafenib‐treated (aGt) cells, aH (m.o.i. 5) excipient‐ (aHnt) and vemurafenib‐treated (aHt) cells, with regard to Ki67 expression show an increase in the size of the high Ki67 cells in NI vemurafenib‐treated and aGt but not aHt cells (red/orange dots in the top‐middle area of the maps). The SPADE spanning tree generated from viSNE maps was used to select four subpopulations (Sp1, Sp2, Sp3, and Sp4): the size of the dots is proportional to the number of cells which is also visible in the adjacent star plots. The color of the dots is an indication of the relative Ki67 expression level (based on the median value for each cluster), from red (high) to dark blue (low). Star plots indicate the size and proportion of each subpopulation (Sp1: red, Sp2: orange, Sp3: yellow, Sp4: blue) and each cluster within them for each spanning tree. Note the overlap zone between Sp1 and Sp2 subpopulations, due to the common included cluster. Initially, we intended to compare excipient‐ and vemurafenib‐treated A375 cells infected at both validated m.o.i. values (Fig. 1D). However, repeatedly following the successive centrifugation steps that are needed to conduct the mass cytometry analysis, a large amount of cells were lost, possibly due to cell fragility in the vemurafenib‐treated aH cells infected at m.o.i. 25 (currently under investigation). This precludes any valid further statistical analysis for these samples. The data shown are therefore those obtained from samples for which the final amount of cells analyzed with mass cytometry were nearly similar (the number of live cells in each subpopulation is indicated above each star plot). (B) GFP marker distribution expression in aGnt and aHnt cells (used as the negative control), shown as an indication of the sensitivity of the mass cytometry analysis.
Figure 3
Figure 3
Comparative analysis of each of the four subpopulations, defined in Figure 2A, based on the distribution of the expression levels in the 12 markers used to generate the viSNE maps, shown for: aGnt/aHnt cells (green/blue histograms, top row of each marker, red and black lines for comparisons of median value), aGt/aHt cells (red bordered green/black bordered blue histograms, bottom row of each marker, red and black lines for comparisons of median value), aGnt/aGt (green/red bordered green histograms, comparison between top and bottom row, red line for comparison of median values), and aHnt/aHt (blue/black bordered blue histograms, comparison between top and bottom row, black line for comparison of median values). The P‐values (t‐test) for paired comparisons are underlined for differences considered significant.

Similar articles

Cited by

References

    1. Tannock, I. F. , and Hickman J. A.. 2016. Limits to personalized cancer medicine. N. Engl. J. Med. 375:1289–1294. - PubMed
    1. Smalley, K. S. 2010. Understanding melanoma signaling networks as the basis for molecular targeted therapy. J. Invest. Dermatol. 130:28–37. - PubMed
    1. Jokinen, E. , and Koivunen J. P.. 2015. MEK and PI3K inhibition in solid tumors: rationale and evidence to date. Ther. Adv. Med. Oncol. 7:170–180. - PMC - PubMed
    1. Nazarian, R. , Shi H., Wang Q., Kong X., Koya R. C., Lee H., et al. 2010. Melanomas acquire resistance to B‐RAF(V600E) inhibition by RTK or N‐RAS upregulation. Nature 468:973–977. - PMC - PubMed
    1. Sun, C. , Wang L., Huang S., Heynen G. J. J. E., Prahallad A., Robert C., et al. 2014. Reversible and adaptive resistance to BRAF(V600E) inhibition in melanoma. Nature 508:118–122. - PubMed

MeSH terms