. 2017 Jul 5;139(26):8828-8836.
doi: 10.1021/jacs.7b01212. Epub 2017 Jun 22.

Nickel Sequestration by the Host-Defense Protein Human Calprotectin

Affiliations

Nickel Sequestration by the Host-Defense Protein Human Calprotectin

Toshiki G Nakashige et al. J Am Chem Soc. .

Abstract

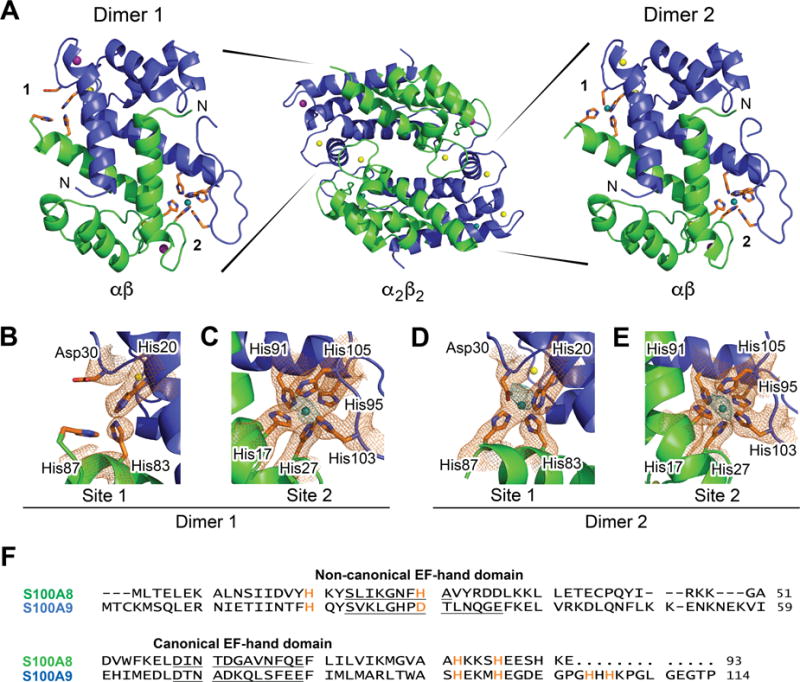
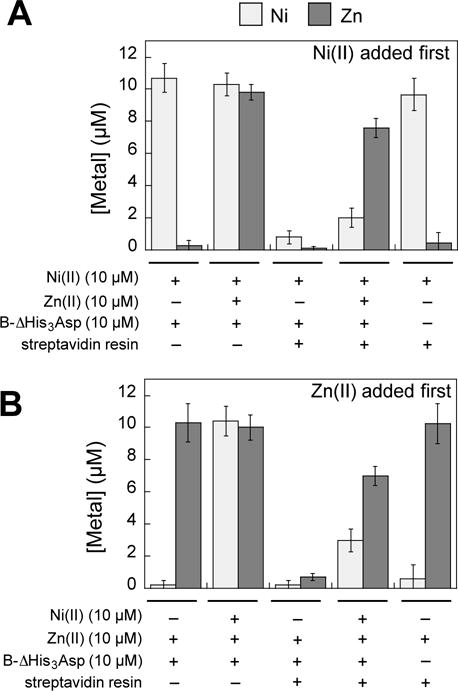
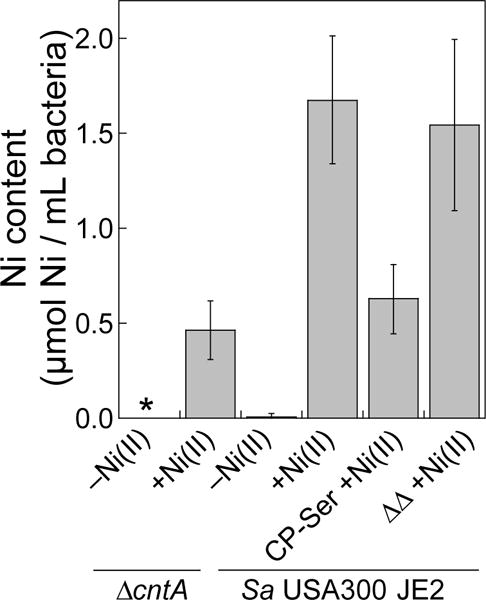
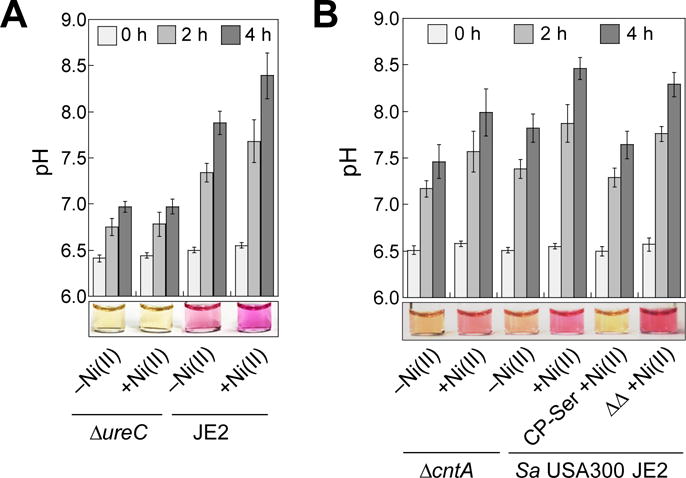
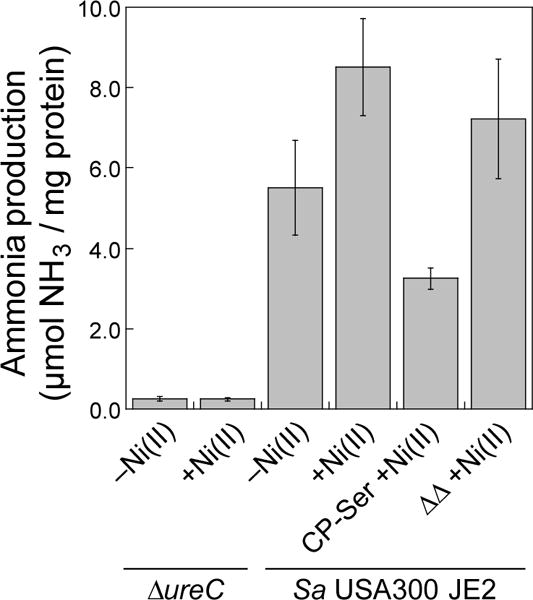
The human innate immune protein calprotectin (CP, S100A8/S100A9 oligomer, calgranulin A/calgranulin B oligomer, MRP-8/MRP-14 oligomer) chelates a number of first-row transition metals, including Mn(II), Fe(II), and Zn(II), and can withhold these essential nutrients from microbes. Here we elucidate the Ni(II) coordination chemistry of human CP. We present a 2.6-Å crystal structure of Ni(II)- and Ca(II)-bound CP, which reveals that CP binds Ni(II) ions at both its transition-metal-binding sites: the His3Asp motif (site 1) and the His6 motif (site 2). Further biochemical studies establish that coordination of Ni(II) at the hexahistidine site is thermodynamically preferred over Zn(II). We also demonstrate that CP can sequester Ni(II) from two human pathogens, Staphylococcus aureus and Klebsiella pneumoniae, that utilize this metal nutrient during infection, and inhibit the activity of the Ni(II)-dependent enzyme urease in bacterial cultures. In total, our findings expand the biological coordination chemistry of Ni(II)-chelating proteins in nature and provide a foundation for evaluating putative roles of CP in Ni(II) homeostasis at the host-microbe interface and beyond.


Figures

Figure 1
Figure 1
X-ray crystallographic analysis of Ni(II)- and Ca(II)-bound CP. (A) Dimer (αβ) and tetramer (α2β2) models of CP-Ser coordinated to Ni(II) (teal), Ca(II) (yellow), and Na(I) (purple). The S100A8 subunit is green, and the S100A9 subunit is blue. The two dimers, denoted dimers 1 and 2, are depicted in 90° rotation to the tetramer and exhibit different metal binding. Dimer 1 (left) contains a Ni(II) ion at site 2 only with apparent 100% occupancy. Dimer 2 (right) contains a Ni(II) ion at site 1 refined at 75% occupancy and a Ni(II) ion at site 2 refined at 100% occupancy. The N-terminus of each subunit is labeled. (B) Site 1 of dimer 1. (C) Site 2 of dimer 1. (D) Site 1 of dimer 2. (E) Site 2 of dimer 2. A 2Fo-Fc composite omit electron density map (orange mesh) to 2.6-Å resolution is contoured at 1σ around the metal sites. A 3.6-Å resolution nickel anomalous difference map, calculated using data collected at a wavelength of 1.4831 Å, is contoured at 3σ and shown in teal. (F) Amino acid sequence alignment of human S100A8 and S100A9. The metal-binding residues are orange. The residues of the EF-hand domains are underlined. The metal speciation of each subunit is described in Table 1
Figure 2
Figure 2
The CP-Ser heterodimer binds two equivalents of Ni(II) in solution whereas the ΔHis3Asp and ΔHis4 variants coordinate only one equivalent of Ni(II) under the same conditions. Samples of 300 μM (A) CP-Ser, (B) ΔHis3Asp, and (C) ΔHis4 preincubated with 5.0 equiv Ni(II) were monitored by analytical SEC in 75 mM HEPES, 100 mM NaCl, pH 7.0. The SEC chromatograms are shown as absorbance (right y-axis) as a function of elution volume (top x-axis). The protein and Ni concentrations (left y-axis) of the eluent fractions (bottom x-axis) were measured by absorbance at 280 nm and by ICP-MS, respectively, and these data are shown as bar plots. Protein concentration is shown as dark gray bars, and the Ni concentration is shown as light gray bars. Data from one representative experiment for each condition is shown.
Figure 3
Figure 3
Metal selectivity of the His6 site ascertained by the B-ΔHis3Asp pull-down assay. The concentrations of Ni(II) and Zn(II) in the supernatant of each sample were determined by ICP- MS. B-ΔHis3Asp (10 μM) was incubated with 10 μM Ni(II), and/or Zn(II) for 72 h at 37 °C in 75 mM HEPES, 100 mM NaCl, 2 mM CaCl2, pH 7.0 and the mixture was treated with streptavidin agarose resin. (A) Ni(II) was added first and the Ni(II) + B-ΔHis3Asp mixture was incubated for 30 min at room temperature prior to addition of Zn(II). (B) Zn(II) was added first. The mean and SDM are reported (n = 4 for samples with B-ΔHis3Asp n added, n = 2 for samples without B-ΔHis3Asp).
Figure 4
Figure 4
CP treatment results in decreased intracellular Ni in S. aureus USA300 JE2 as measured by ICP-MS. The mean Ni content of the bacterial cells (OD600 = 6, ≈109 CFU/mL) and SDM are reported (n = 6). The asterisk denotes Ni levels below the detection limit. Data for S. aureus M2 and ATCC 29213 are provided in Figures S9.
Figure 5
Figure 5
CP attenuates urease activity of S. aureus USA300 JE2 as indicated by directly measuring pH (bar plots) and visual detection using the colorimetric pH indicator phenol red (photographs below bar plots, pKa = 7.5 at 25 °C, ref. 50), which turns from yellow to purple with increasing pH. (A) The pH profile and a representative image of dCDMU from bacterial cultures of S. aureus USA300 JE2 and ΔureC grown in the absence and presence of a 1-μM Ni(II) supplement (14-18 h, 37 °C). The mean pH values and SDM are reported (n = 3). The image was taken at t = 4 h. (B) The pH profile and a representative image of dCDMU from bacterial cultures of S. aureus USA300 JE2 and ΔcntA grown in the absence and presence of 1 μM Ni(II) and CP variants (14-18 h, 37 °C). The image was taken at t = 2 h. The mean pH values and SDM are reported (n = 6).
Figure 6
Figure 6
Urease activity of S. aureus USA300 JE2 and ΔureC cell lysates monitored by the direct detection of ammonium ions using the phenol-hypochlorite assay. Prior to the assay, bacteria were cultured in dCDM without ammonium in the absence or presence of 1 μM Ni(II) and CP variants as indicated (8 h, 37 °C). Mean μmol ammonia/mg protein and SDM are reported (n = 12).

References

    1. Ragsdale SW. J Biol Chem. 2009;284:18571–18575. - PMC - PubMed
    1. Li Y, Zamble DB. Chem Rev. 2009;109:4617–4643. - PubMed
    1. Mulrooney SB, Hausinger RP. FEMS Microbiol Rev. 2003;27:239–261. - PubMed
    1. Brown PH, Welch RM, Cary EE. Plant Physiol. 1987;85:801–803. - PMC - PubMed
    1. Barondeau DP, Kassmann CJ, Bruns CK, Tainer JA, Getzoff ED. Biochemistry. 2004;43:8038–8047. - PubMed

Publication types

MeSH terms