. 2017 Jun 2;14(6):592.
doi: 10.3390/ijerph14060592.

The Influence of Quercetin on Maternal Immunity, Oxidative Stress, and Inflammation in Mice with Exposure of Fine Particulate Matter during Gestation

Affiliations

The Influence of Quercetin on Maternal Immunity, Oxidative Stress, and Inflammation in Mice with Exposure of Fine Particulate Matter during Gestation

Wei Liu et al. Int J Environ Res Public Health. .

Abstract

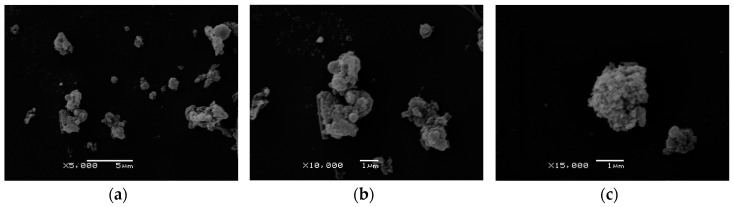
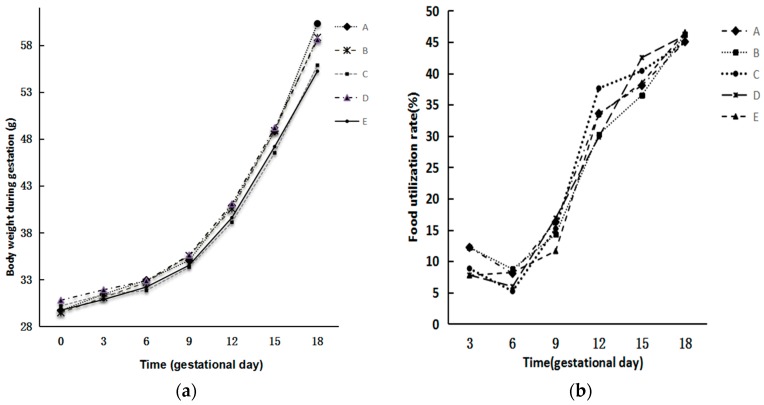
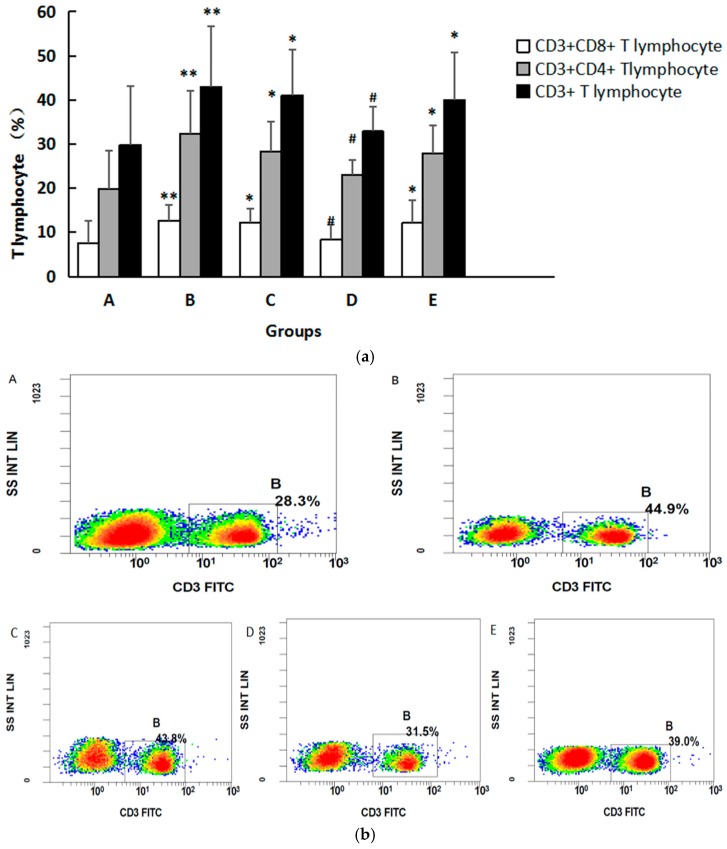
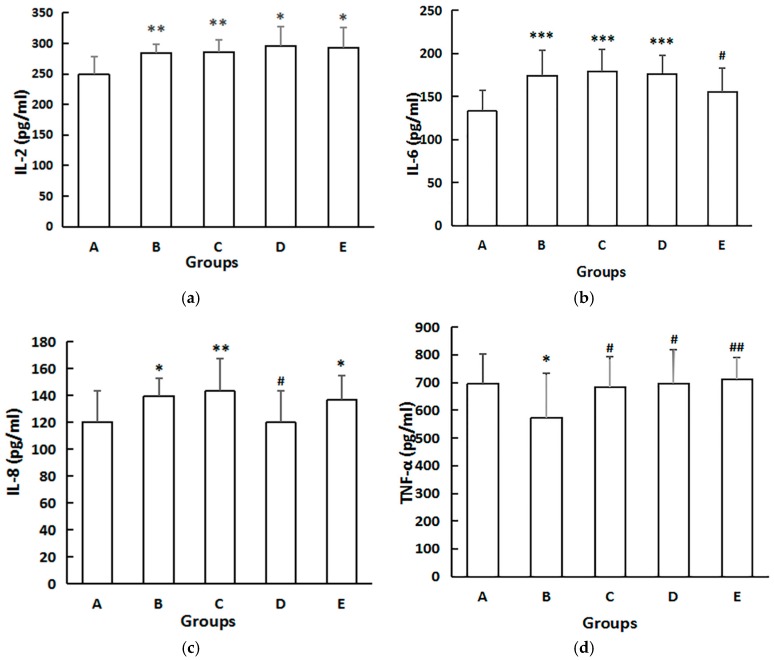
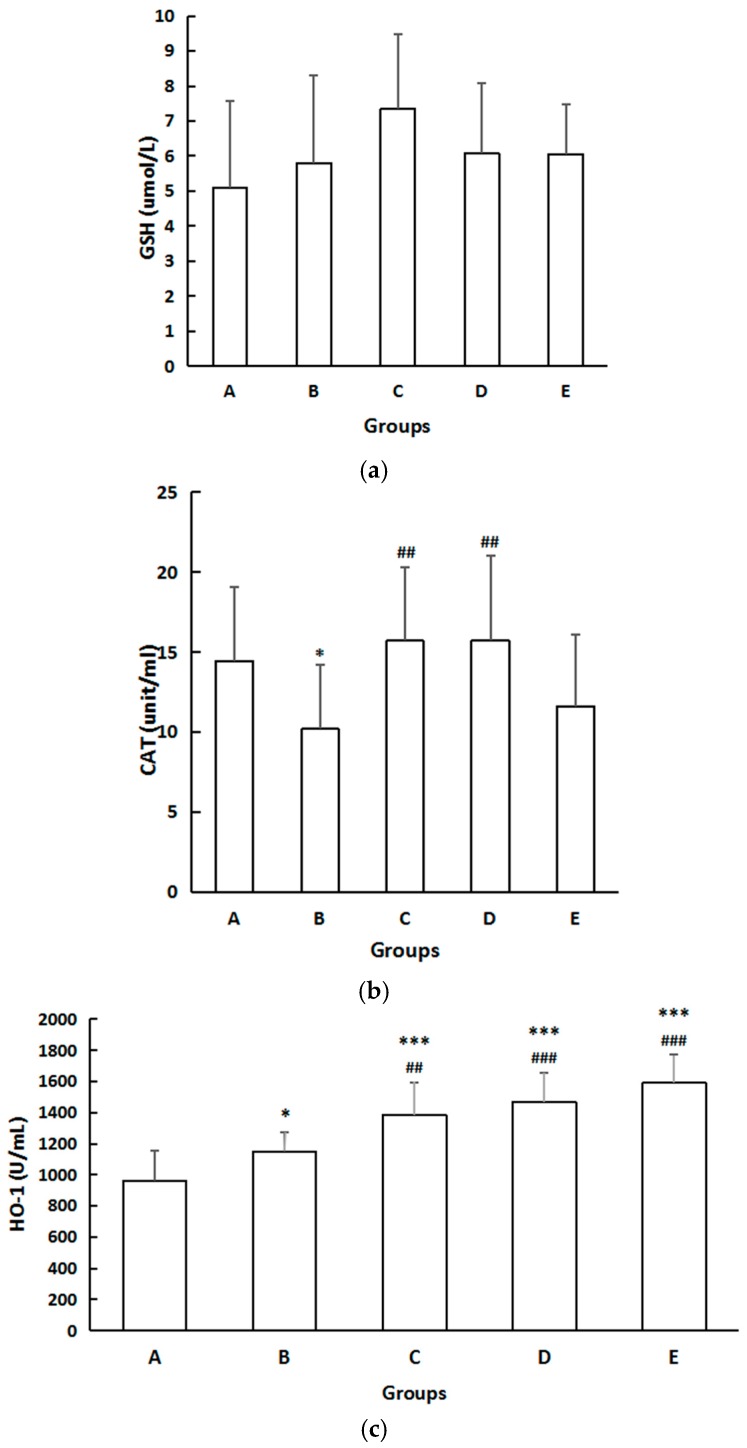
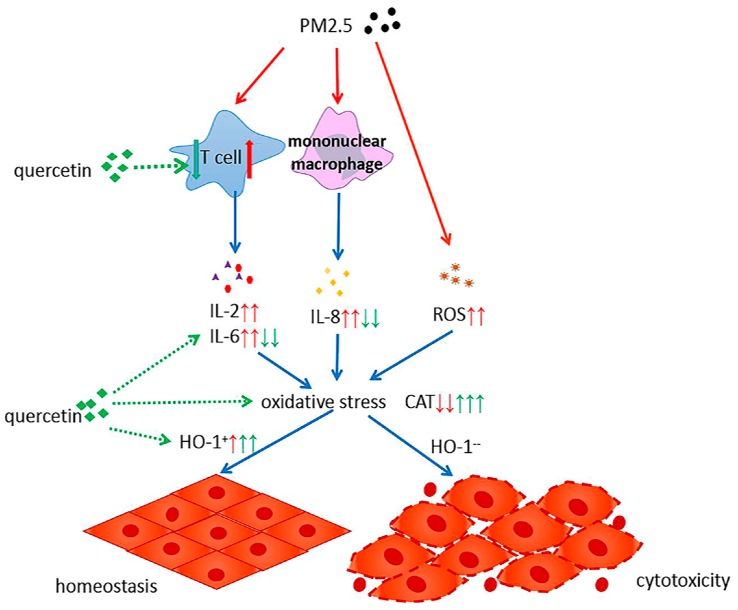
The objective is to investigate the influence of PM2.5 exposure on peripheral blood lymphocyte subsets in pregnant mice and the antagonism of quercetin on adverse effects induced by PM2.5 exposure. Pregnant mice were randomly divided into control group, PM2.5 model group and 3 quercetin intervention groups. Dams in all groups except the control group were exposed to PM2.5 suspension by intratracheal instillation on gestational day (GD) 3, 6, 9, 12 and 15. Meanwhile, each dam was given 0.15% carboxymethylcellulose sodium (CMCS) (control group & PM2.5 model group) and different doses of quercetin (quercetin intervention groups) by gavage once a day from GD0 to GD17. The percentage of lymphocyte subsets, Biomarkers of systemic inflammation injuries (IL-2, IL-6, IL-8 & TNF-α) and oxidative stress indicators (CAT, GSH & HO-1) in peripheral blood of the dams were analyzed. The number of T cells increased, accompanied by increased level of IL-2, IL-6, IL-8 and HO-1 due to PM2.5 exposure. Less CD4+ and CD8+ T cells were counted in 100 mg/kg quercetin intervention group, compared with PM2.5 model group. Quercetin may inhibit cytokine production, especially in IL-6 and IL-8 and may upgrade the level of HO-1. Our findings indicate that PM2.5 could significantly influence the distribution of T-lymphocyte subsets, activate inflammatory reaction and elevate oxidative stress level in peripheral blood of pregnant mice. Certain dose of quercetin administration during pregnancy may protect the dams against the adverse effects through various ways.

Keywords: PM2.5; inflammation; lymphocyte subset; oxidative stress; pregnancy; quercetin.


Conflict of interest statement

The authors declare no conflict of interest.

Figures

Figure 1
Figure 1
Morphology of PM2.5 particles. (a) Large area image of PM2.5 suspension (5000×); (b) Partial area image of PM2.5 suspension (10,000×); (c) SEM images of particles with rough surface. The scale bars are 5 μm for image (a), 1 μm for image (b), and 1 μm for image (c).
Figure 2
Figure 2
Changes of body weight and food utilization rate of dams in different groups. (a) Changes of body weight; (b) Changes of food utilization rate. The food utilization rate was calculated from the following equation: food utilization rate = weight gain/food consumption × 100%. There was no significant difference in body weight and food utilization rate among the five groups (p > 0.05).
Figure 3
Figure 3
Effects of quercetin on maternal lung structure and injury score with PM2.5 exposure during gestation. (a) Lung sections were stained with hematoxylin and eosin. Original magnification, ×200. Arrows indicate typical areas with inflammatory cell infiltrates. Circles indicate typical areas with interstitial congestion and hyaline membrane formation. Boxes indicate typical area with hemorrhage; (b) Slides were scored by two independent blinded observers for the severity evaluation of lung injury. Histology scores are displayed as mean ± SD. Compared with Group A, * indicates p < 0.05, ** indicates p < 0.01, *** indicates p < 0.001. The analysis of scores of interstitial congestion and hyaline membrane formation and hemorrhage were conducted with “Tamhane’s T2 test”.
Figure 4
Figure 4
(a) Changes of T lymphocytes in serum of mice in different groups. The data are expressed as mean ± SD. Compared with Group A, * indicates p < 0.05, ** indicates p < 0.01. Compared with Group B, # indicates p < 0.05; (b) Representative flow plots showing CD3 staining in cells; (c) Representative flow plots showing CD3 and CD4 staining in cells; (d) Representative flow plots showing CD3 and CD8 staining in cells.
Figure 4
Figure 4
(a) Changes of T lymphocytes in serum of mice in different groups. The data are expressed as mean ± SD. Compared with Group A, * indicates p < 0.05, ** indicates p < 0.01. Compared with Group B, # indicates p < 0.05; (b) Representative flow plots showing CD3 staining in cells; (c) Representative flow plots showing CD3 and CD4 staining in cells; (d) Representative flow plots showing CD3 and CD8 staining in cells.
Figure 5
Figure 5
The effect on dams serum concentrations of cytokines. (a) Effect on serum IL-2; (b) Effect on serum IL-6; (c) Effect on serum IL-8; (d) Effect on serum TNF-α. The serum levels of IL-2, IL-6, IL-8, and TNF-α in serum were detected by ELISA according to the manual of ELISA kits. The data are expressed as mean ± SD of each group. Compared with Group A, * indicates p < 0.05, ** indicates p < 0.01, *** indicates p < 0.001. Compared with Group B, # indicates p < 0.05, ## indicates p < 0.01. The analysis of IL-6 was conducted with “Tamhane’s T2 test”.
Figure 6
Figure 6
(a) The effect on GSH. The data are expressed as mean ± SD of each group. There was no difference in serum GSH among five groups; (b) The effect on CAT. The data are expressed as mean ± SD of each group. Compared with Group A, * indicates p < 0.05. Compared with Group B, ## indicates p < 0.01; (c) The effect on concentration of HO-1. The data are expressed as mean ± SD of each group. Compared with Group A, * indicates p < 0.05, *** indicates p < 0.001. Compared with Group B, ## indicates p < 0.01, ### indicates p < 0.001.
Figure 7
Figure 7
The mechanism of quercetin suppressing the adverse health effects of PM2.5. and indicates the effects of PM2.5; and indicates the effects of quercetin.

References

    1. Malmqvist E., Larsson H.E., Jonsson I., Rignell-Hydbom A., Ivarsson S.A., Tinnerberg H., Stroh E., Rittner R., Jakobsson K., Swietlicki E., et al. Maternal exposure to air pollution and type 1 diabetes—Accounting for genetic factors. Environ. Res. 2015;140:268–274. doi: 10.1016/j.envres.2015.03.024. - DOI - PubMed
    1. Dales R., Chen L., Frescura A.M., Liu L., Villeneuve P.J. Acute effects of outdoor air pollution on forced expiratory volume in 1 s: A panel study of schoolchildren with asthma. Eur. Respir. J. 2009;34:316–323. doi: 10.1183/09031936.00138908. - DOI - PubMed
    1. Lim S.S., Vos T., Flaxman A.D., Danaei G., Shibuya K., Adair-Rohani H., Amann M., Anderson H.R., Andrews K.G., Aryee M., et al. A comparative risk assessment of burden of disease and injury attributable to 67 risk factors and risk factor clusters in 21 regions, 1990–2010: A systematic analysis for the Global Burden of Disease Study 2010. Lancet. 2012;380:2224–2260. doi: 10.1016/S0140-6736(12)61766-8. - DOI - PMC - PubMed
    1. Sillanpää M., Hillamo R., Saarikoski S., Frey A., Pennanen A., Makkonen U., Spolnik Z., Grieken R.V., Braniš M., Brunekreef B. Chemical composition and mass closure of particulate matter at six urban sites in Europe. Atmos. Environ. 2006;40:212–223. doi: 10.1016/j.atmosenv.2006.01.063. - DOI
    1. Bjorksten B. The Window of Opportunity: Pre-Pregnancy to 24 Months of Age. Volume 61. Karger Publishers; Basel, Switzerland: 2008. Environmental influences on the development of the immune system: Consequences for disease outcome; pp. 243–254. - DOI - PubMed

LinkOut - more resources