. 2017 Sep;24(9):1598-1608.
doi: 10.1038/cdd.2017.84. Epub 2017 Jun 2.

Role of Atg5-dependent cell death in the embryonic development of Bax/Bak double-knockout mice

Affiliations

Role of Atg5-dependent cell death in the embryonic development of Bax/Bak double-knockout mice

Satoko Arakawa et al. Cell Death Differ. 2017 Sep.

Abstract

Programmed cell death, which is required for the development and homeostasis of metazoans, includes mechanisms such as apoptosis, autophagic cell death, and necrotic (or type III) death. Members of the Bcl2 family regulate apoptosis, among which Bax and Bak act as a mitochondrial gateway. Although embryonic fibroblasts from Bax/Bak double-knockout (DKO) mice are resistant to apoptosis, we previously demonstrated that these cells die through an autophagy-dependent mechanism in response to various types of cellular stressors. To determine the physiological role of autophagy-dependent cell death, we generated Atg5/Bax/Bak triple-knockout (TKO) mice, in which autophagy is greatly suppressed compared with DKO mice. Embryonic fibroblasts and thymocytes from TKO mice underwent autophagy much less frequently, and their viability was much higher than DKO cells in the presence of certain cellular stressors, providing genetic evidence that DKO cells undergo Atg5-dependent death. Compared with wild-type embryos, the loss of interdigital webs was significantly delayed in DKO embryos and was even further delayed in TKO embryos. Brain malformation is a distinct feature observed in DKO embryos on the 129 genetic background, but not in those on a B6 background, whereas such malformations appeared in TKO embryos even on a B6 background. Taken together, our data suggest that Atg5-dependent cell death contributes to the embryonic development of DKO mice, implying that autophagy compensates for the deficiency in apoptosis.


Conflict of interest statement

The authors declare no conflict of interest.

Figures
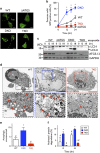
Figure 1
Figure 1
Lack of autophagy in Atg5/Bax/Bak TKO MEFs treated with etoposide. (a,b) MEFs transfected with GFP-LC3 were treated with 20 μM etoposide for the indicated times and then examined using fluorescence microscopy. Representative images acquired at 16 h are shown in (a). Scale bars=10 μm. (b) The population of cells with GFP-LC3 puncta was calculated. Four independent experiments were performed for each type of MEF, and data represent the mean±S.D. *P<0.05 versus the value of WT. (c–e) MEFs were treated with 20 μM etoposide for the indicated times. In panel (c), cell lysates were subjected to immunoblot analysis using antibodies against LC3, Atg5, or GAPDH (as a control). (d) (top row) Representative electron micrographs of the indicated MEFs treated with etoposide for 16 h (WT) and 24 h (DKO and TKO). ‘N’ indicates the nucleus. Scale bars=5 μm. (bottom row) Photographs are magnified images of the areas within the dotted squares in the top row. Arrows indicate autophagosomes/autolysosomes. Scale bar=1 μm. (e) The number of autophagic structures per cell was determined from the EM images. Data are shown as the mean+S.D. WT, n=14; DKO, n=15; TKO, n=22. (f) Induction of long-lived protein degradation by etoposide. WT MEFs (white columns), DKO MEFs (blue columns), and TKO MEFs (red columns) were treated with 10 μM etoposide for the indicated times in the presence of 100 μM zVAD-fmk, and the turnover of long-lived proteins was measured. Values were obtained by subtraction of basal protein degradation as follows: (% protein degradation in etoposide-treated cells)−(% protein degradation in healthy cells). We performed four independent experiments using each type of MEFs. Data are shown as the mean+S.D. In (e,f), *P<0.05 versus the value of WT; #P<0.05 versus the value of DKO
Figure 2
Figure 2
Viability of Atg5/Bax/Bak TKO and Bax/Bak DKO MEFs treated with etoposide and STS. (a) WT, DKO, and TKO MEFs were treated with 20 μM etoposide for the indicated times, and cell viability was assessed using the CTB assay. (b) MEFs treated with etoposide (20 μM) were examined using phase-contrast microscopy. Scale bar=10 μm. (c) DKO and TKO MEFs were treated with 20 μM etoposide for 24 h, and 5 × 10³ cells were seeded in normal medium, and the number of viable cells was measured on the indicated days using the CTB assay. (d) DKO and TKO MEFs were treated with 20 μM etoposide for 24 h and 2 × 10³ cells were seeded in normal medium, cultured for 1 week, and the images of the colonies formed were acquired. (e) WT, DKO, and TKO MEFs were treated with 1 μM STS for the indicated times, and cell viability was assessed using the CTB assay. (f) Atg5-silenced DKO and control DKO MEFs were treated with 20 μM etoposide for the indicated times, and cell viability was assessed using the CTB assay. (g) Atg5-silenced DKO MEFs and control DKO MEFs were treated with 20 μM etoposide for 24 h and 2 × 10³ cells were seeded in normal medium, cultured for 1 week, and the images of the colonies formed were acquired. (h) DKO (blue) and TKO (red) MEFs were treated with 20 μM etoposide in the presence (striped columns) or absence (filled columns) of 10 mM 3-MA for the indicated periods, and cell viability was assessed by the CTB assay. (i, j) DKO and TKO MEFs were silenced with Beclin-1 siRNA (si Bec) or control siRNA (si cont) for 24 h and treated with 20 μM etoposide. MEFs were examined using phase-contrast microscopy. Representative images acquired at 24 h are shown in (i). Scale bars=20 μm. (j) Cell viability was assessed at 48 h using the CTB assay. In (a,c,e), data represent the mean±S.D. *P<0.05 versus the value of WT; #P<0.05 versus the value of DKO. In (f), data represent the mean±S.D. #P<0.05 versus the value of siControl DKO. In (h,j), data represent the mean+S.D. #P<0.05 versus the value of control DKO. ‘ns’ indicates no significant difference. Each experiment was performed four independent times
Figure 3
Figure 3
Morphology of Atg5/Bax/Bak TKO MEFs treated with etoposide. (ad) Representative electron micrographs of DKO and TKO MEFs treated with etoposide (20 μM) for 24 h. Numerous autophagosomes/autolysosomes (arrows) were observed in DKO MEFs (a) but not in TKO MEFs (b). Magnified images of the areas surrounded by a dotted box and a white box in (b) are shown in (c,d), respectively. In (c), nuclear membrane distortion (arrows) is evident. (d) Colocalization of nucleolonema (arrowhead) and mitochondria (arrows). Scale bar=5 μm (a,b) and 1 μm (c,d). ‘N’ indicates the nucleus. (e) Representative laminA/C-immunofluorescence images of MEFs treated with or without etoposide for 48 h. DNA was counterstained with DAPI. Scale bar=5 μm
Figure 4
Figure 4
Viability of Atg5/Bax/Bak TKO thymocytes and Bax/Bak DKO thymocytes. (a) Thymocytes were treated with STS (0.5 μM), and cell death was determined using the PI assay at the indicated times. (b,c) Morphology of thymocytes treated with STS (0.5 μM) for 12 h. Representative electron micrographs are shown in (b). Images of ‘Apoptosis’ and ‘Nuclear membrane dissociation’ were obtained from Bak KO and DKO thymocytes, respectively. ‘N’ indicates nuclei. Images of ‘hyperactivated autophagy’ were obtained from DKO thymocytes. Magnified image of the area within the square is shown on the right. Arrows indicate autophagic vacuoles. Images of ‘Nuclear membrane disruption’ were from TKO thymocytes. Magnified image of the area within the square is shown on the right. Arrows indicate mitochondria inside the nucleus. Scale bars=0.5 μm (magnified images) and 1 μm (other images). The population of cells exhibiting each of the morphologies shown in (b) is presented in (c). ‘Apoptosis,’ ‘Hyperactivated autophagy,’ ‘Nuclear membrane disruption,’ and ‘Nuclear membrane dissociation’ are indicated in white, blue, red, and green, respectively. (d) Death of STS-treated DKO thymocytes is suppressed by 3-MA. DKO thymocytes were treated with 0.5 μM STS together with 5 mM 3-MA (green symbols), 100 μM z-VAD-fmk (purple symbols), or without the addition of any reagent (blue symbols) for the indicated times, and cell viability was assessed using the PI assay. (e–h) Response of DKO and TKO thymocytes to X-ray irradiation, etoposide, and an anti-CD3 antibody. Bak KO, DKO, and TKO thymocytes were treated with X-ray irradiation (5 Gy) (e,f), 1 μM etoposide (g), or an anti-CD3 antibody (1 mg/ml) (h). (e) Representative electron micrographs of thymocytes treated with X-ray irradiation. Autophagic structures were not observed in DKO thymocytes and TKO thymocytes. Scale bars=2 μm. (f–h) Cell viability was assessed using the PI assay at the indicated times. In (a,d,f–h), all of the experiments were performed using four independent thymi. Data represent the mean±SD. (a, f–h) *P<0.05 versus the value of ΔBak; #P<0.05 versus the value of DKO thymocytes. (d) *P<0.05 versus the value of no added drug. ‘ns’ indicates no significant difference
Figure 5
Figure 5
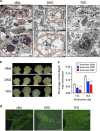
Delay of interdigital web disappearance in Atg5/Bax/Bak TKO embryos and Bax/Bak DKO embryos. (a) (Top row) Representative electron micrographs of the interdigital web of the indicated embryos on E14.5. Scale bars=5 μm. (Bottom row) Magnified images of the areas enclosed in boxes in the top row. Scale bars=1 μm. In Bak KO embryos, numerous apoptotic nuclei (purple circles) are engulfed by macrophages (orange circles). In DKO embryos, cells with numerous autophagic vacuoles containing digested substrates are evident (orange circle). Macrophages were not observed in the interdigital webs. In TKO embryos, most cells died with nuclear damage (arrows). Macrophages were not observed in interdigital webs. (b) Gross appearance of the interdigital webs of the limbs of indicated embryos on E14.5. Scale bar=1 mm. (c) Percentages of the eliminated interdigital web area were determined on E14.5 and E15.5. The method of calculation is described in Methods and Supplementary Figure 7. The same number of littermate embryos were examined for each genotype. White, blue, and red columns indicate Bak KO, DKO, and TKO embryos, respectively; n=48 limbs (E14.5) and 36 limbs (E15.5). *P<0.05 versus Bak KO; #P<0.05 versus DKO. (d) The presence of autophagic cells in the interdigital webs of DKO embryos. Interdigital webs from the indicated littermate embryos were frozen, and autophagic cells were visualized using immunofluorescence staining with an anti-LC3-II antibody. Representative images are shown. Autophagic cells contain LC3 puncta. Scale bar=50 μm
Figure 6
Figure 6
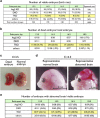
Death and abnormal brain development in TKO embryos on a B6 background. (a,b) The tables show the population of viable embryos (a) and dead embryos (b) on the indicated embryonic days. In (a), ‘Expected rate’ indicates the Mendelian ratio. Yellow rows indicate ‘TKO’. (c) A representative dead TKO embryo is shown together with a normal embryo on E13.5. Scale bar=2 mm. (d) Representative photographs showing brain malformation in TKO embryos with a normal embryo in a C57BL/6 background. (e) The table indicates the population of embryos with an abnormal brain. Yellow row indicates ‘TKO’

References

    1. Clarke PG. Developmental cell death: morphological diversity and multiple mechanisms. Anat Embryol 1990; 181: 195–213. - PubMed
    1. Tsujimoto Y. Cell death regulation by the Bcl-2 protein family in the mitochondria. J Cell Physiol 2003; 195: 158–167. - PubMed
    1. Baehrecke EH. How death shapes life during development. Nat Rev Mol Cell Biol 2002; 3: 779–787. - PubMed
    1. Das G, Shravage BV, Baehrecke EH. Regulation and function of autophagy during cell survival and cell death. Cold Spring Harb Perspect Biol 2012; 4: a008813. - PMC - PubMed
    1. Xie Z, Klionsky DJ. Autophagosome formation: core machinery and adaptations. Nat Cell Biol 2007; 9: 1102–1109. - PubMed

MeSH terms

Substances