. 2017 Sep;24(9):1564-1576.
doi: 10.1038/cdd.2017.79. Epub 2017 Jun 2.

MYCN amplified neuroblastoma requires the mRNA translation regulator eEF2 kinase to adapt to nutrient deprivation

Affiliations

MYCN amplified neuroblastoma requires the mRNA translation regulator eEF2 kinase to adapt to nutrient deprivation

Alberto Delaidelli et al. Cell Death Differ. 2017 Sep.

Abstract

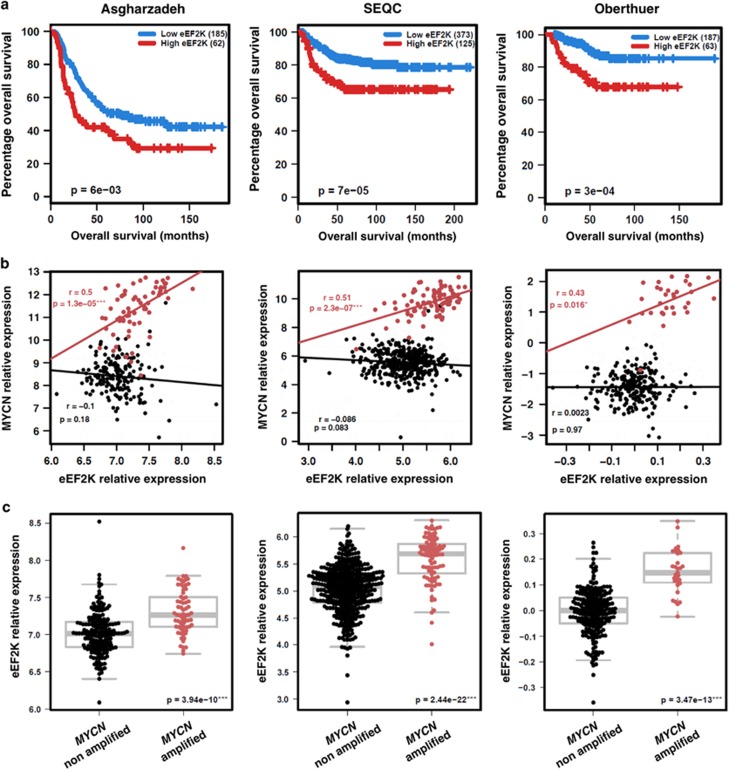
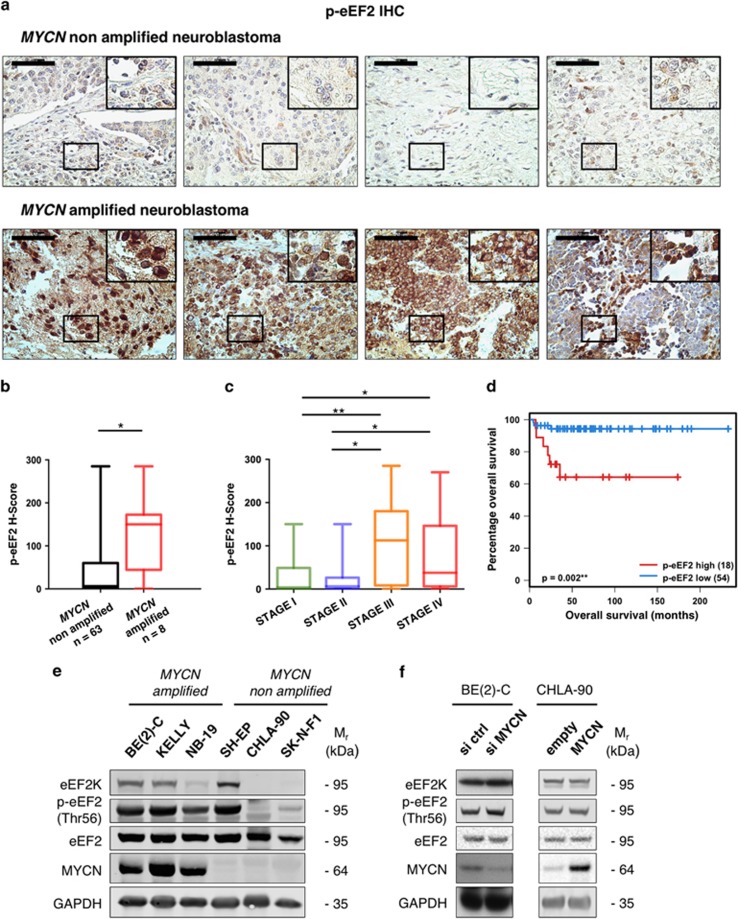
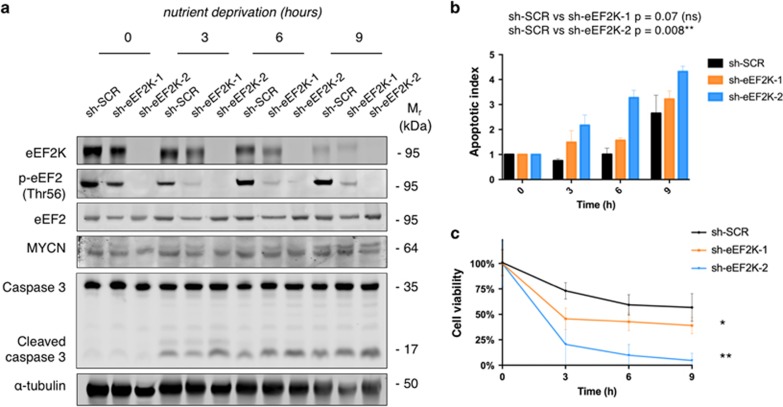
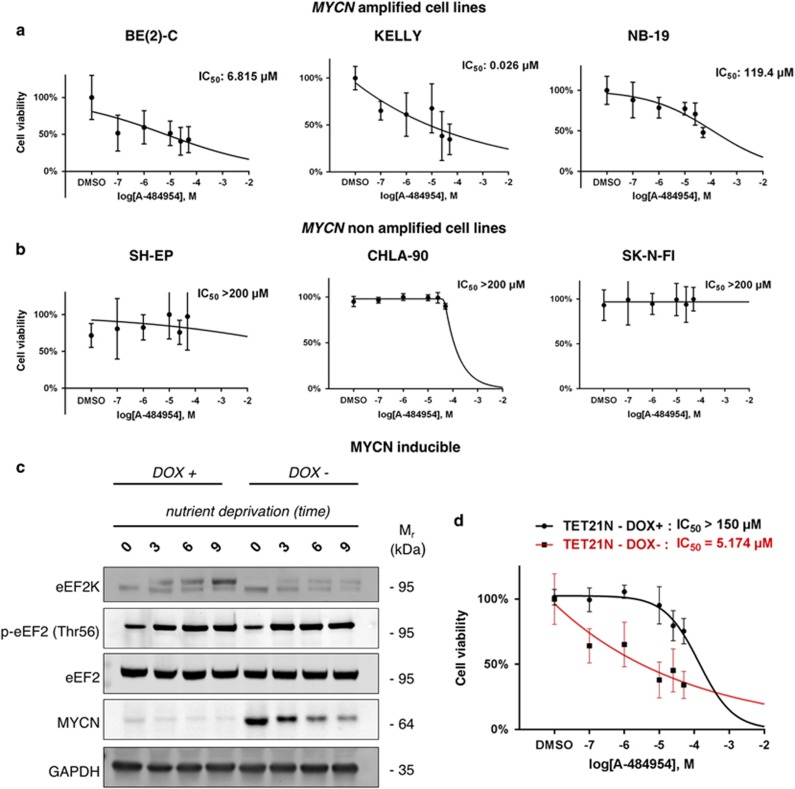
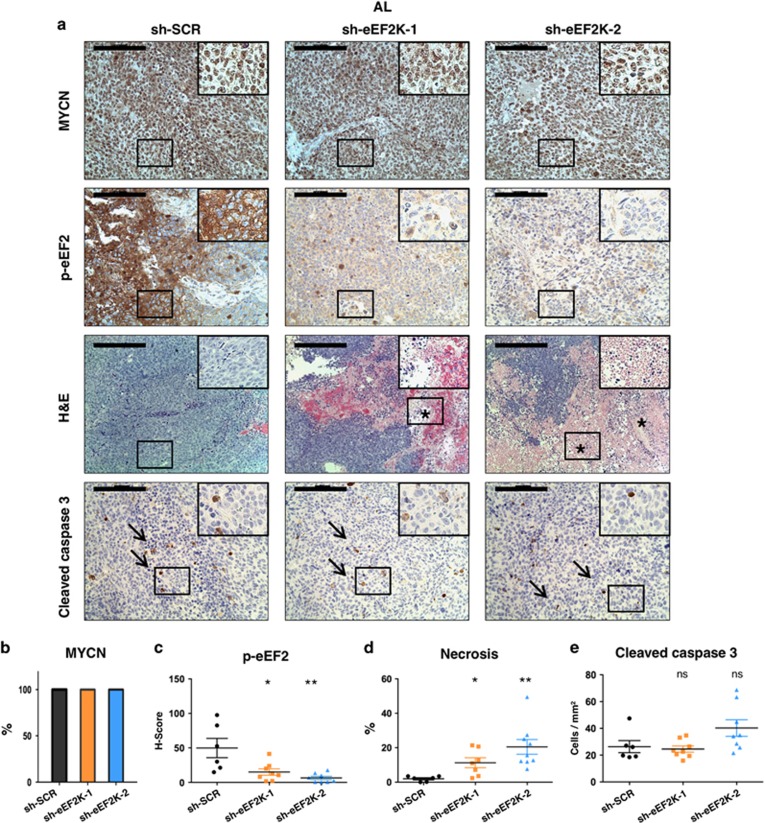
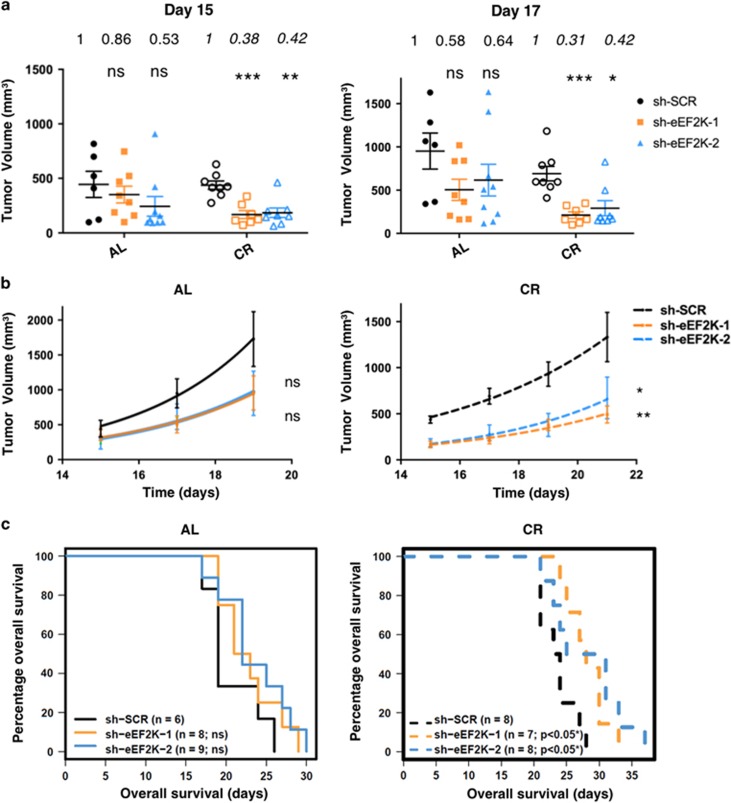
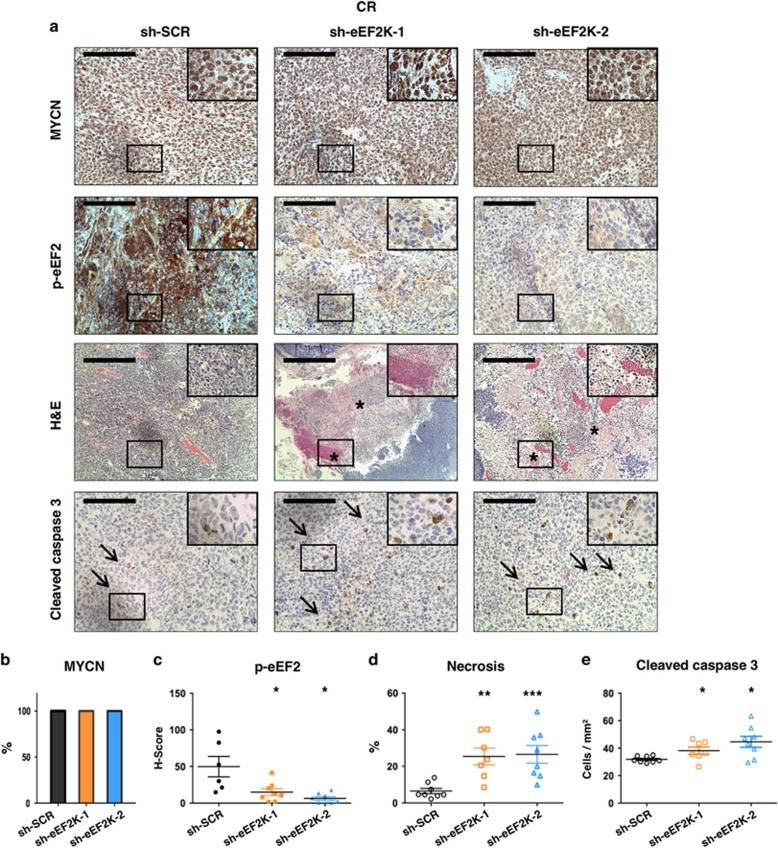
MYC family proteins are implicated in many human cancers, but their therapeutic targeting has proven challenging. MYCN amplification in childhood neuroblastoma (NB) is associated with aggressive disease and high mortality. Novel and effective therapeutic strategies are therefore urgently needed for these tumors. MYC-driven oncogenic transformation impairs cell survival under nutrient deprivation (ND), a characteristic stress condition within the tumor microenvironment. We recently identified eukaryotic Elongation Factor 2 Kinase (eEF2K) as a pivotal mediator of the adaptive response of tumor cells to ND. We therefore hypothesized that eEF2K facilitates the adaptation of MYCN amplified NB to ND, and that inhibiting this pathway can impair MYCN-driven NB progression. To test our hypothesis, we first analyzed publicly available genomic databases and tissue microarrays for eEF2K expression in NB, and for links between eEF2K, MYCN, and clinical outcome in NB. Effects of eEF2K inhibition were evaluated on survival of MYCN amplified versus non-amplified NB cell lines under ND. Finally, NB xenograft mouse models were used to confirm in vitro observations. Our results indicate that high eEF2K expression and activity are strongly predictive of poor outcome in NB, and correlates significantly with MYCN amplification. Inhibition of eEF2K markedly decreases survival of MYCN amplified NB cell lines in vitro under ND. Growth of MYCN amplified NB xenografts is markedly impaired by eEF2K knockdown, particularly under caloric restriction. In summary, eEF2K protects MYCN overexpressing NB cells from ND in vitro and in vivo, highlighting this kinase as a critical mediator of the adaptive response of MYCN amplified NB cells to metabolic stress.


Conflict of interest statement

The authors also thank Amy Li, Melvin Pan, Jordan Cran, Saki Konomura, and Sylvia Lee for technical assistance. The authors have no conflicts of interest to disclose.

Figures

Figure 1
Figure 1
Clinical relevance of eEF2K mRNA expression in NB. (a) eEF2K higher expression correlates with poor outcome in NB. Survival curves by Kaplan Meier plotting, cases were split based on eEF2K expression. (b) eEF2K and MYCN expression correlates in MYCN amplified NB (r=Pearson’s correlation coefficient). (c) eEF2K is overexpressed in MYCN amplified NB compared to non-MYCN amplified NB. Cases were split based on MYCN amplification status and eEF2K expression was measured. Each analysis is performed on three different cohorts (Asgharzadeh n=247; SEQC n=493; Oberthuer n=250). *P<0.05, **P<0.01, ***P<0.001. Data obtained from the R2 platform (http://r2.amc.nl)
Figure 2
Figure 2
eEF2K is highly active in MYCN amplified NB. (a) Representative IHC images for p-eEF2 (Thr56) performed on the neuroblastoma TMA. Every image is representative of a different patient. Scale bar=50 μm. (b) H-score based quantification of p-eEF2 (Thr56) IHC on the CHOP neuroblastoma TMA. The cohort was split based on MYCN amplification status. (c) H-score based quantification of p-eEF2 (Thr56) IHC on the CHOP neuroblastoma TMA. The cohort was split based on INSS stage. (d) Survival analysis by Kaplan–Meyer plotting on the CHOP neuroblastoma TMA based on p-eEF2 H-score. *P<0.05, **P<0.01, ***P<0.001. (e) Western blotting analysis of neuroblastoma cell lines with or without MYCN amplification. (f) Left: SH-EP neuroblastoma cells with or without stable overexpression of MYCN were lysed and analyzed by immunoblotting for the indicated proteins. Right: BE(2)-C neuroblastoma cells (with MYCN amplification) were transiently transfected with control (si ctrl) or MYCN (si MYCN) siRNAs. Cells were lysed 72 h post transfection and analyzed by immunoblotting for the indicated proteins
Figure 3
Figure 3
Genetic inactivation of eEF2K impairs the adaptive response of MYCN amplified BE(2)-C cells to acute ND. (a) Western blotting analysis on the BE(2)-C cell line ±shRNA mediated eEF2K knockdown under acute ND at different time-points. Equal loading of protein samples is verified with α-tubulin. (b) PI/Annexin V flow cytometry based staining for the BE(2)C cell line ±shRNA mediated eEF2K knockdown over time of acute ND. Apoptotic index is defined as the ratio between PI-Annexin V double positive cells over PI-Annexin V double negative cells. Values are normalized for every cell line for the apoptotic index at time 0 (baseline). (c) MTT assay measuring BE(2)-C ±shRNA mediated eEF2K knockdown cells survival under acute ND at different time-points. The experiment is carried out in eight replicates
Figure 4
Figure 4
A-484954 impairs MYCN overexpressing NB cell line survival under ND. (a,b) Dose-response curve for the MYCN amplified (a) and MYCN non-amplified cell lines (b) after 48 h of ND and different concentrations of A-484954 or equal dose of DMSO. Cell viability values are normalized for the DMSO (control) average cell viability value at the specific time-point. Each MTT assay is carried out in eight replicates. (c) Western blot analysis on the Tet21N cell line under ND at different time-points. GAPDH is used to verify equal samples loading. (d) Dose-response curve for the Tet21N cell line after 48 h of ND and different concentrations of A-484954 or equal dose of DMSO. Cell viability values are normalized for the DMSO (control) average cell viability value at the specific time-point. Each MTT assay is carried out in eight replicates. The 48 h time point was chosen for the dose-response curves and to calculate the IC50 values based on the results of the time course analysis for all the cell lines, showing the most significant differences in cell viability at this specific time point
Figure 5
Figure 5
Inactivation of eEF2K induces massive necrotic cell death in MYCN amplified NB in vivo. (a) Representative IHC and H&E images of subcutaneous tumor xenografts derived from the MYCN amplified BE(2)-C cell line ±eEF2K knockdown. Asterisks (*) indicate areas of necrosis and arrows (→) indicate apoptotic cells. Scale bar represents 100 μm on IHC images and 200 μm on HE images. (b) Graphic representing the quantification of percentage of MYCN positive tumors by IHC. (c) Graphic evaluating p-eEF2 H-score by IHC. (d) Graphic representing the percentage amount of necrosis on H&E sections. (e) Quantification of cleaved caspase three positive cells by IHC. The figure represents the experiment with mice fed AL. The sample size for the IHC analysis in the figure is as follows: sh-SCR n=6; sh-eEF2K-1 n=8; sh-eEF2K-2 n=9. *P<0.05, **P<0.01, ***P<0.001
Figure 6
Figure 6
CR synergizes with eEF2K inactivation to inhibit growth of MYCN amplified NB xenografts in vivo. (a) BE(2)-C derived ±eEF2K knockdown tumors were measured by caliper at day 15 and 17 after tumor xeno-transplantation into mice fed with AL or CR diet. After day 17, mice killing was required as tumors in some mice exceeded humane practice guidelines. (b) Analysis of BE(2)-C derived ±eEF2K knockdown tumor growth and mice survival by Kaplan–Meyer plotting (c) in mice fed AL or with CR diet. Mice were killed when tumors reached 1,500 mm3. The sample size for the analysis in the figure is as follows: AL: as in the previous figure. CR: sh-SCR n=8; sh-eEF2K-1 n=7; sh-eEF2K-2 n=8. *P<0.05, **P<0.01, ***P<0.001
Figure 7
Figure 7
CR and inactivation of eEF2K induce massive necrotic cell death and apoptosis in MYCN amplified NB in vivo. (a) Representative IHC and H&E images of subcutaneous tumor xenografts derived from the MYCN amplified BE(2)-C cell line ±eEF2K knockdown, grown in mice under CR. Arrows (→) indicate apoptotic cells and asterisks (*) indicate areas of necrosis. Scale bar represents 100 μm on IHC images and 200 μm on H&E images. (b) Graphic representing the quantification of percentage of MYCN positive tumors by IHC. (c) Graphic evaluating p-eEF2 H-score by IHC. (d) Graph representing the percentage amount of necrosis on H&E sections. (e) Quantification of cleaved caspase three positive cells by IHC. The figure represents the experiment with mice fed with CR died. The sample size for the IHC analysis in the figure is as follows: sh-SCR n=6; sh-eEF2K-1 n=8; sh-eEF2K-2 n=9. *P<0.05, **P<0.01, ***P<0.001

Comment in

  • eEF2K protects MYCN-amplified cells from starvation.
    Delaidelli A, Leprivier G, Sorensen PH. Delaidelli A, et al. Cell Cycle. 2017 Sep 17;16(18):1633-1634. doi: 10.1080/15384101.2017.1355180. Epub 2017 Aug 2. Cell Cycle. 2017. PMID: 28767324 Free PMC article. No abstract available.

References

    1. Kohl NE, Kanda N, Schreck RR, Bruns G, Latt SA, Gilbert F et al. Transposition and amplification of oncogene-related sequences in human neuroblastomas. Cell 1983; 35(2 Pt 1): 359–367. - PubMed
    1. Schwab M, Varmus HE, Bishop JM, Grzeschik KH, Naylor SL, Sakaguchi AY et al. Chromosome localization in normal human cells and neuroblastomas of a gene related to c-myc. Nature 1984; 308: 288–291. - PubMed
    1. Nau MM, Brooks BJ, Battey J, Sausville E, Gazdar AF, Kirsch IR et al. L-myc, a new myc-related gene amplified and expressed in human small cell lung cancer. Nature 1985; 318: 69–73. - PubMed
    1. Soucek L, Evan GI. The ups and downs of Myc biology. Curr Opin Genet Dev 2010; 20: 91–95. - PMC - PubMed
    1. Iritani BM, Eisenman RN. c-Myc enhances protein synthesis and cell size during B lymphocyte development. Proc Natl Acad Sci USA 1999; 96: 13180–13185. - PMC - PubMed

Substances