. 2017 Jul 4;8(27):44312-44325.
doi: 10.18632/oncotarget.17871.

The impact of EpCAM expression on response to chemotherapy and clinical outcomes in patients with epithelial ovarian cancer

Affiliations

The impact of EpCAM expression on response to chemotherapy and clinical outcomes in patients with epithelial ovarian cancer

Shingo Tayama et al. Oncotarget. .

Abstract

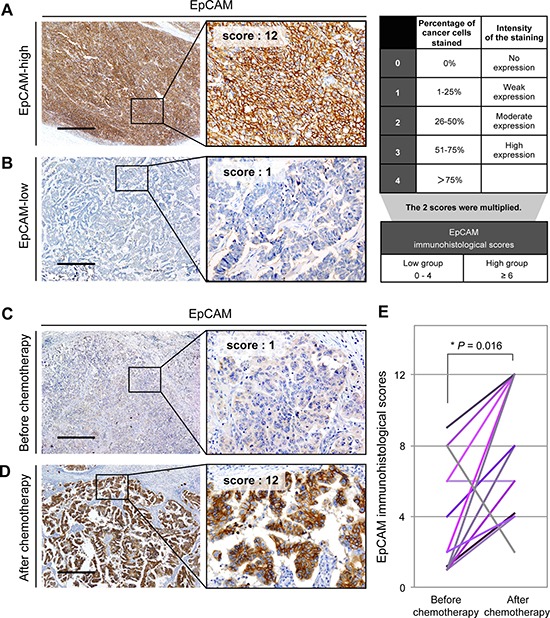
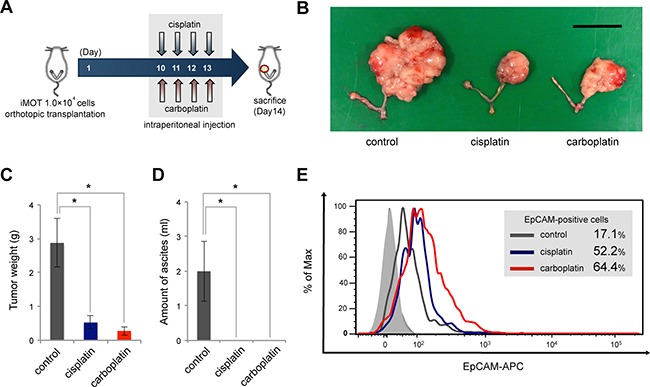
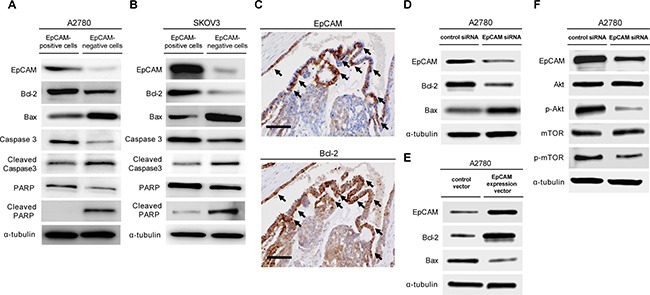
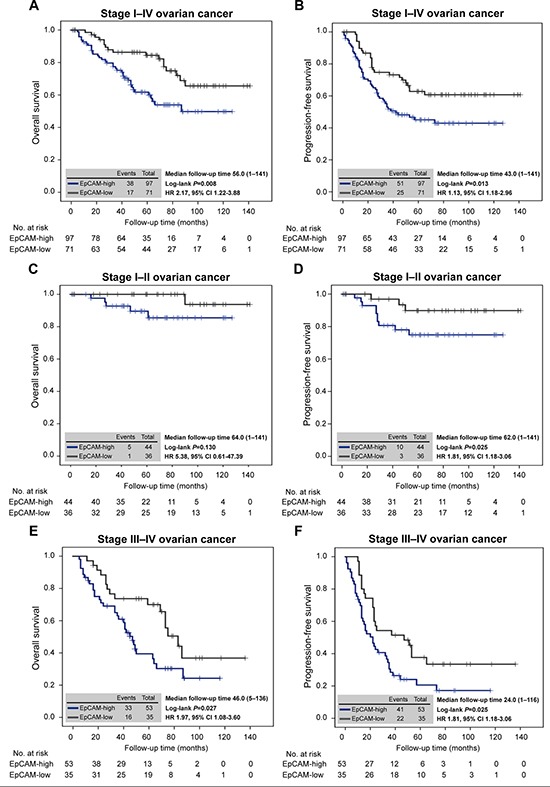
Epithelial ovarian cancer is a highly lethal malignancy; moreover, overcoming chemoresistance is the major challenging in treating ovarian cancer patients. The cancer stem cell (CSC) hypothesis considers CSCs to be the main culprits in driving tumor initiation, metastasis, and resistance to conventional therapy. Although growing evidence suggest that CSCs are responsible for chemoresistance, the contribution of CSC marker EpCAM to resistance to chemotherapy remains unresolved.Here we have demonstrated that ovarian cancers containing high levels of EpCAM have a significantly much lower probability of achieving overall responsive rates after first-line chemotherapy. In addition, multivariate analysis revealed that EpCAM expression is an independent risk factor for chemoresistance, indicating that EpCAM expression is a predictive biomarker of chemotherapeutic response. Consistent with these clinical observations, in vitro assays, we found that the subpopulation of EpCAM-positive ovarian cancer cells shows a significantly higher viability compared with EpCAM-negative cells in response to cisplatin treatment by preventing chemotherapy-induced apoptosis, which is regulated by EpCAM-Bcl-2 axis. Furthermore, in an in vivo mouse model, platinum agents preferentially eliminated EpCAM-negative cells in comparison with EpCAM-positive cells, suggesting that the remaining subpopulation of EpCAM-positive cells contributes to tumor recurrence after chemotherapy. Finally, we also found that an increased expression of EpCAM is associated with poor prognosis in ovarian cancer patients.Our findings highlight the clinical significance of EpCAM in the resistance to chemotherapy and provide a rationale for EpCAM-targeted therapy to improve chemoresistance. Targeting EpCAM should be a promising approach to effectively extirpate the CSCs as the putative root of ovarian cancer.

Keywords: EpCAM; cancer stem cell; chemoresistance; ovarian cancer; prognosis.


Conflict of interest statement

CONFLICTS OF INTEREST

The authors declare no conflicts of interest.

Figures

Figure 1
Figure 1. EpCAM expression is increased in ovarian cancer tissues obtained after platinum-based chemotherapy
(A) A representative immunohistochemical staining pattern for EpCAM in the EpCAM-high group. EpCAM-high group was defined as a total score ≥ 6 (Scale bar: 500 μm). (B) A representative immunohistochemical staining pattern for EpCAM in the EpCAM-low group. EpCAM-low group was defined as a total score 0 to 4 (Scale bar: 500 μm). (C) Immunohistochemical analysis with anti-EpCAM antibody of ovarian cancer tissues from patients treated without preoperative chemotherapy (Scale bar, 500 μm). (D) Immunohistochemical analysis with anti-EpCAM antibody of ovarian cancer tissues from patients treated with adjuvant chemotherapy (Scale bar, 500 μm). (E) Statistical analysis of the immunohistochemical scores of EpCAM in 13 paired samples. The scores of EpCAM expression are significantly higher in ovarian cancer tissues from patients treated with chemotherapy than in those from matched patients treated without chemotherapy (Wilcoxon signed-rank test, *P = 0.016).
Figure 2
Figure 2. The subpopulation of EpCAM-positive ovarian cancer cells is associated with chemoresistance to platinum chemotherapeutic agents in vitro
(A) Flow cytometric analysis of ovarian cancer cell lines with APC-conjugated antibody to EpCAM. (B) Flow cytometric analysis of EpCAM expression in A2780 and SKOV3 cells. Treatment with cisplatin resulted in enhanced expression of EpCAM in residual cancer cells as compared with untreated cells. (C) Chemosensitivity assay in FACS-sorted EpCAM-positive and EpCAM-negative cancer cells. Cells were subjected to MTS assay to assess the viability in the presence of cisplatin. Sorted EpCAM-positive cancer cells showed significantly higher viability compared with sorted EpCAM-negative cancer cells (*P < 0.01).
Figure 3
Figure 3. EpCAM-positive ovarian cancer cells are correlated with tumor resistance to chemotherapy in an in vivo mouse model
(A) Schema of platinum chemotherapeutic treatments in an orthotopic ovarian tumor mouse model. iMOT cells (1.0 × 10⁴ cells) were transplanted into the left ovarian bursa of 7-week-old female C57BL/6 mice. Ovarian tumor-bearing mice received intraperitoneal injections of cisplatin, carboplatin, or PBS on days 10, 11, 12, 13 after orthotopic transplantation, respectively. (B) Macroscopic appearance of mouse ovarian tumors treated with or without platinum agents at 14 days after orthotopic cell transplantation (Scale bar, 2 cm). (C) Tumor weight determined at 14 days after cell injection in each group. Quantitative data are presented as mean ± SD for five mice (*P < 0.01). (D) Ascitic volume evaluated at 14 days after cell transplantation in each group. Quantitative data are presented as mean ± SD for five mice (*P < 0.01). (E) Flow cytometric analysis of EpCAM expression in mouse ovarian tumors treated with or without platinum agents. Platinum agents induced substantial enrichment of the EpCAM-positive cells in mouse ovarian tumors.
Figure 4
Figure 4. The subpopulation of EpCAM-positive ovarian cancer cells prevents platinum anticancer drug-induced apoptosis
To compare the anti-apoptotic ability of EpCAM-positive and EpCAM-negative cancer cells, we sorted EpCAM-positive and EpCAM-negative cells from the A2780 ovarian cancer cell line (A) and SKOV3 cell line (B). FACS-sorted EpCAM-positive and -negative cells were treated with18 μM cisplatin for 24 h, and the expression of apoptosis-associated proteins, including bcl-2, bax, caspase-3, and poly (ADP-ribose) polymerase (PARP), were examined by western blot analysis. (C) Representative immunohistochemical EpCAM and Bcl-2 staining in serial sections of ovarian cancer specimens. Bcl-2 was mainly detected EpCAM-positive cancer cells (arrows) (Scale bar: 100 μm). (D) Immunoblot analysis of EpCAM, Bcl-2, and Bax in A2780 cells transfected EpCAM or control siRNAs. (E) Immunoblot analysis of EpCAM, Bcl-2, and Bax in A2780 cells transduced overexpressing EpCAM (pCMV6-EpCAM expression vector) and their respective controls (pCMV6 empty vector). (F) A2780 cells transfected with EpCAM or control siRNAs were subjected to immunoblot analysis with indicated antibodies.
Figure 5
Figure 5. EpCAM expression predicts ovarian cancer survival
(A) Kaplan–Meier analysis of overall survival in patients with stage I–IV ovarian cancer according to the expression of EpCAM. There were significant differences in overall survival between the EpCAM-high and -low groups (HR, 2.17; 95% CI, 1.22–3.88; P = 0.008). (B) Kaplan–Meier analysis of progression-free survival in patients with stage I–IV ovarian cancer according to the expression of EpCAM. Progression-free survival was significantly different between the EpCAM-high and -low groups (HR, 1.13; 95% CI, 1.18–2.96; P = 0.013). (C) Kaplan–Meier analysis of overall survival in patients with stage I–II ovarian cancer according to the expression of EpCAM. There were no significant differences in overall survival between the EpCAM-high and -low groups (HR, 5.38; 95% CI, 0.61–47.39; P = 0.130). (D) Kaplan–Meier analysis of progression-free survival in patients with stage I–II ovarian cancer according to the expression of EpCAM. Progression-free survival was significantly different between the EpCAM-high and -low groups (HR, 1.81; 95% CI, 1.18–3.06; P = 0.025). (E) Kaplan–Meier analysis of overall survival in patients with stage III–IV ovarian cancer according to the expression of EpCAM. Overall survival was significantly different between the EpCAM-high and EpCAM-low groups (HR, 1.97; 95% CI, 1.08–3.60; P = 0.027). (F) Kaplan–Meier analysis of progression-free survival in patients with stage III–IV ovarian cancer according to the expression of EpCAM. There were significant differences in progression-free survival between the EpCAM-high and -low groups (HR, 1.81; 95% CI, 1.18–3.06; P = 0.025).

Similar articles

Cited by

References

    1. Bast RC, Jr, Hennessy B, Mills GB. The biology of ovarian cancer: new opportunities for translation. Nat Rev Cancer. 2009;9:415–428. - PMC - PubMed
    1. Miranda F, Mannion D, Liu S, Zheng Y, Mangala LS, Redondo C, Herrero-Gonzalez S, Xu R, Taylor C, Chedom DF, Karaminejadranjbar M, Albukhari A, Jiang D, et al. Salt-Inducible Kinase 2 Couples Ovarian Cancer Cell Metabolism with Survival at the Adipocyte-Rich Metastatic Niche. Cancer Cell. 2016;30:273–289. - PubMed
    1. Vaughan S, Coward JI, Bast RC, Jr, Berchuck A, Berek JS, Brenton JD, Coukos G, Crum CC, Drapkin R, Etemadmoghadam D, Friedlander M, Gabra H, Kaye SB, et al. Rethinking ovarian cancer: recommendations for improving outcomes. Nat Rev Cancer. 2011;11:719–725. - PMC - PubMed
    1. Yap TA, Carden CP, Kaye SB. Beyond chemotherapy: targeted therapies in ovarian cancer. Nat Rev Cancer. 2009;9:167–181. - PubMed
    1. Agarwal R, Kaye SB. Ovarian cancer: strategies for overcoming resistance to chemotherapy. Nat Rev Cancer. 2003;3:502–516. - PubMed

MeSH terms

Substances