. 2017 Jun 2;13(6):e1005581.
doi: 10.1371/journal.pcbi.1005581. eCollection 2017 Jun.

A motor unit-based model of muscle fatigue

Affiliations

A motor unit-based model of muscle fatigue

Jim R Potvin et al. PLoS Comput Biol. .

Abstract

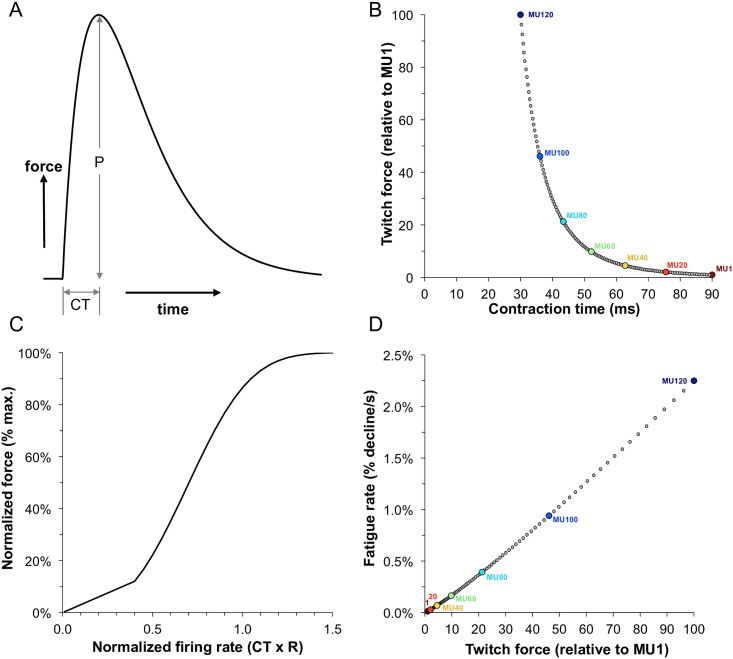
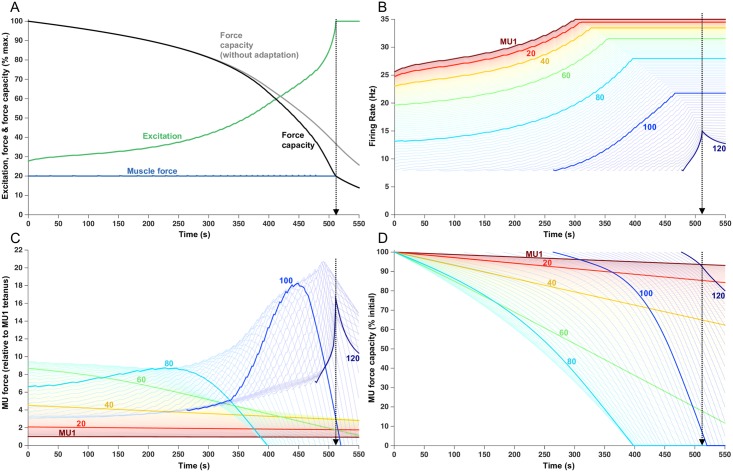
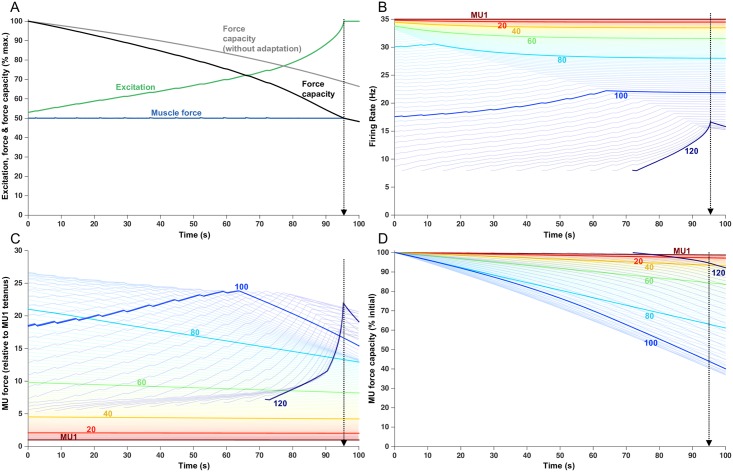
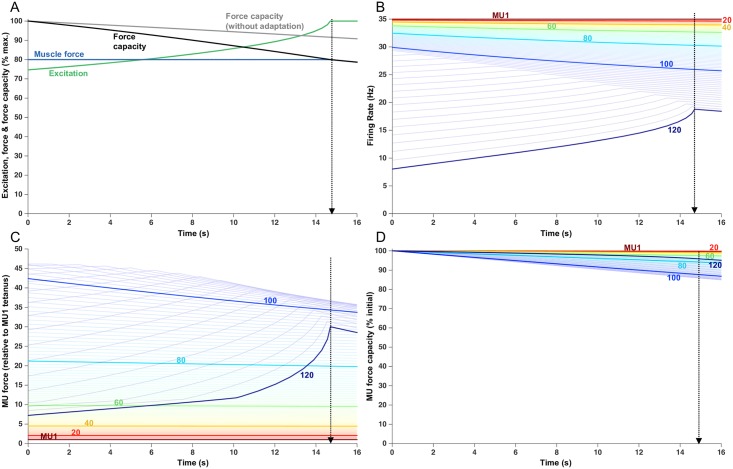
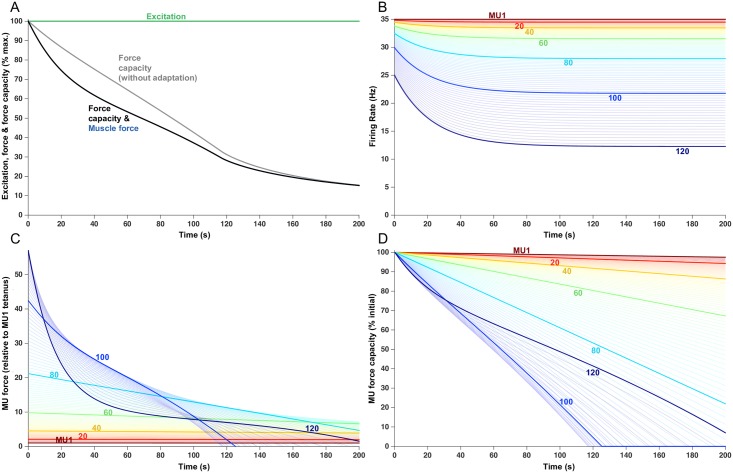
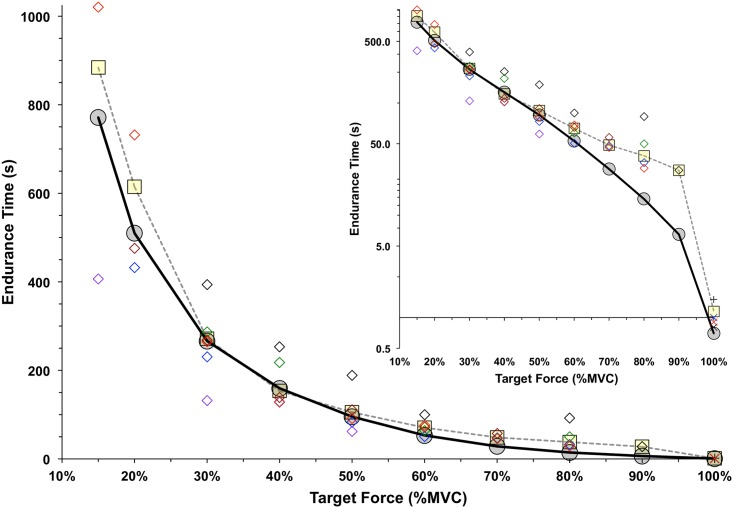
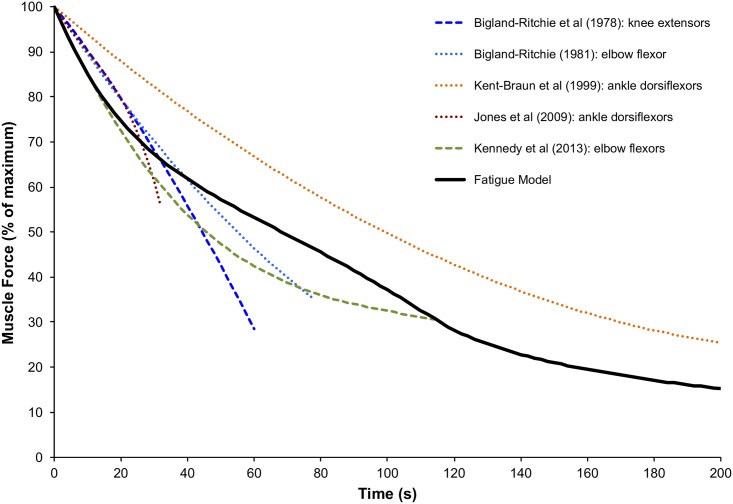
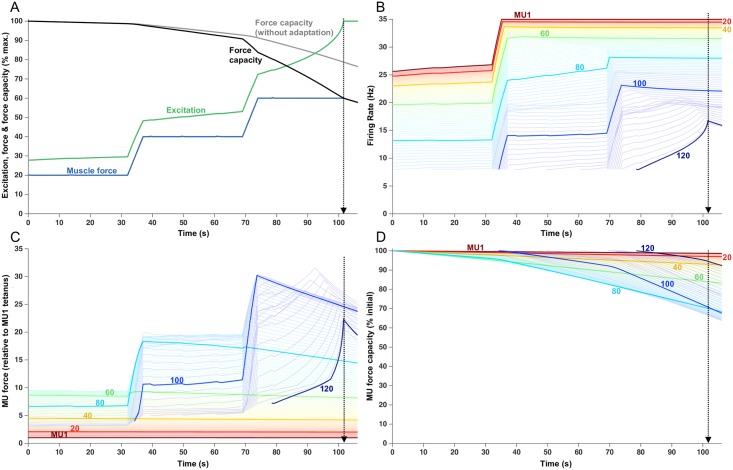
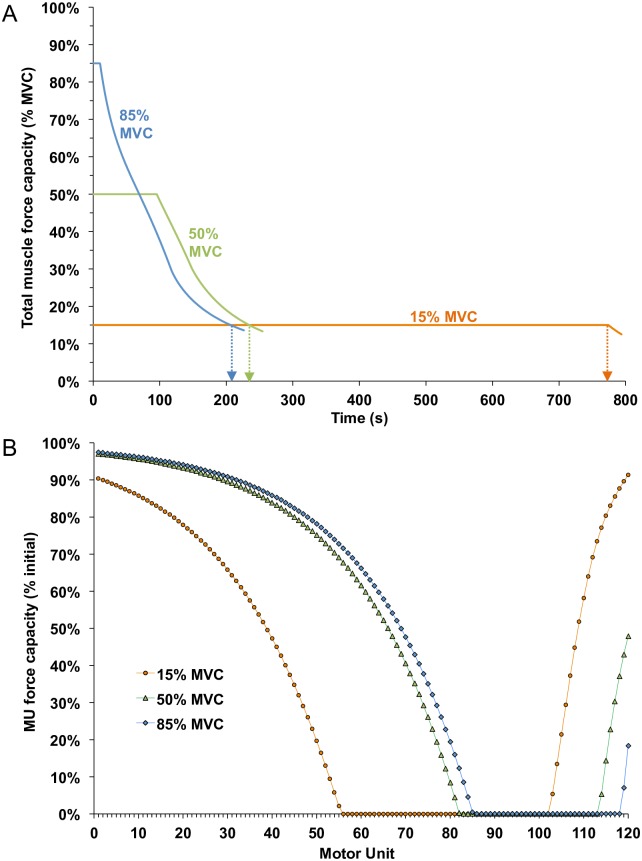
Muscle fatigue is a temporary decline in the force and power capacity of skeletal muscle resulting from muscle activity. Because control of muscle is realized at the level of the motor unit (MU), it seems important to consider the physiological properties of motor units when attempting to understand and predict muscle fatigue. Therefore, we developed a phenomenological model of motor unit fatigue as a tractable means to predict muscle fatigue for a variety of tasks and to illustrate the individual contractile responses of MUs whose collective action determines the trajectory of changes in muscle force capacity during prolonged activity. An existing MU population model was used to simulate MU firing rates and isometric muscle forces and, to that model, we added fatigue-related changes in MU force, contraction time, and firing rate associated with sustained voluntary contractions. The model accurately estimated endurance times for sustained isometric contractions across a wide range of target levels. In addition, simulations were run for situations that have little experimental precedent to demonstrate the potential utility of the model to predict motor unit fatigue for more complicated, real-world applications. Moreover, the model provided insight into the complex orchestration of MU force contributions during fatigue, that would be unattainable with current experimental approaches.


Conflict of interest statement

The authors have declared that no competing interests exist.

Figures

Fig 1
Fig 1. Summary of the motor unit and fatigue model parameters.
(A) Example of a twitch response indicating the peak twitch force (P) and contraction time (CT). (B) Inverse relationship between the modeled contraction times and peak twitch forces across the motor units. Values for every 20th MU are shown. (C) Relationship between normalized firing rate and normalized force. This was modeled to be the same for each motor unit. (D) Direct relationship between modeled peak twitch force and fatigability across motor units.
Fig 2
Fig 2. Fatigue model outputs for a sustained 20% MVC force.
The endurance time of 511.5 s is indicated with the vertical dotted lines. (A) Increased excitation in response to fatigue. Force capacity is shown with and without firing rate adaptation and the modeled force remains at the target load until the endurance time. (B) Firing rate of each MU, over the course of the trial. Lines begin when the MU was recruited. Each 20th MU is highlighted and labelled, but all 120 MUs are shown as lighter lines. (C) Force contribution of each MU. (D) Relative force capacity of each MU (normalized to its rested capacity).
Fig 3
Fig 3. Fatigue model outputs for a sustained 50% MVC load with an endurance time of 95.5 s.
(A) Increased excitation in response to fatigue. Force capacity is shown with and without firing rate adaptation and the modeled force remains at the target load until the endurance time. (B) Firing rate of each MU, over the course of the trial. Lines begin when the MU was recruited. Each 20th MU is highlighted and labelled, but all 120 MUs are shown as lighter lines. (C) Force contribution of each MU. (D) Relative force capacity of each MU (normalized to its rested capacity). Note the higher y-axis scale (30) than with the 20% MVC force (22).
Fig 4
Fig 4. Fatigue model outputs for a sustained 80% MVC load with an endurance time of 14.8 s.
(A) Increased excitation in response to fatigue. Force capacity is shown with and without firing rate adaptation and the modeled force remains at the target load until the endurance time. (B) Firing rate of each MU, over the course of the trial. Lines begin when the MU was recruited. Each 20th MU is highlighted and labelled, but all 120 MUs are shown as lighter lines. (C) Force contribution of each MU. (D) Relative force capacity of each MU (normalized to its rested capacity). Note the higher y-axis scale (50) than with the 20% MVC force (22) and 50% MVC force (30).
Fig 5
Fig 5. Fatigue model outputs for a sustained 100% MVC load for 200 s.
(A) Increased excitation in response to fatigue. Force capacity is shown with and without firing rate adaptation and the modeled force remains at the target load until the endurance time. (B) Firing rate of each MU, over the course of the trial. Lines begin when the MU was recruited. Each 20th MU is highlighted and labelled, but all 120 MUs are shown as lighter lines. (C) Force contribution of each MU. (D) Relative force capacity of each MU (normalized to its rested capacity). Note the higher y-axis scale (57) than with the 20% MVC (22), 50% MVC (30), and 80% MVC (50) force.
Fig 6
Fig 6. The model-predicted endurance times (grey circles) are compared to those from empirical studies (yellow squares).
The endurance times summarized by Frey Law & Avin (2010) were used for contraction levels from 15% to 90% MVC, and a weighted average was calculated at each load based on the number of means involved. Open diamonds indicate the weighted averages for the ankle (black), knee (blue), trunk (green), shoulder (purple), elbow (red) and hand (brown). The data of Fig 5 were used to calculate the average duration until a 1% MVC drop with a 100% MVC load for Jones et al [39] for ankle dorsiflexors (X), Kent-Braun et al [38] for ankle dorsiflexors (+), Bigland-Ritchie et al [36] for knee extensors (blue X) and Bigland-Ritchie [37] for elbow flexors (red X). The inset graph shows the endurance times on a log scale.
Fig 7
Fig 7. The decline in force capacity with a 100% MVC load, from Bigland-Ritchie et al [36], Bigland-Ritchie [37], Kent-Braun et al [38], Jones et al [39], and Kennedy et al. [40], are compared to the fatigue model output with and without excitation adaptation.
Fig 8
Fig 8. Fatigue model outputs for a series of progressively higher force plateaus, involving 32 seconds of 20, 40 and 60% separated by 5 s linear ramps from one level to the next.
Endurance time was 101.5 s. (A) Increased excitation in response to fatigue. Force capacity is shown with and without firing rate adaptation and the modeled force remains at the target load until the endurance time. (B) Firing rate of each MU, over the course of the trial. Lines begin when the MU was recruited. Each 20th MU is highlighted and labelled, but all 120 MUs are shown as lighter lines. (C) Force contribution of each MU. (D) Relative force capacity of each MU (normalized to its rested capacity).
Fig 9
Fig 9. The total muscle and motor unit capacities for initial target forces of 15, 50 and 85% until total muscle capacity decreased to 15% MVC (ie. 85% muscle fatigue for each trial).
(A) Fatigue model outputs for total muscle capacity. Arrows indicate when force fell below 15% MVC. (B) Final force capacity of each MU, normalized to its rested capacity, when total muscle capacity reached 15% MVC for each initial force condition (shown with a vertical arrow in 9A).

References

    1. Allen DG, Lamb GD, Westerblad H. Skeletal muscle fatigue: cellular mechanisms. Physiol Rev. American Physiological Society; 2008;88: 287–332. - PubMed
    1. Fitts RH. Cellular mechanisms of muscle fatigue. Physiol Rev. American Physiological Society; 1994;74: 49–94. - PubMed
    1. Kent-Braun JA, Fitts RH, Christie A. Skeletal muscle fatigue. Compr Physiol. 2012;2: 997–1044. 10.1002/cphy.c110029 - DOI - PubMed
    1. Gandevia SC, Allen GM, Mckenzie DK. Central fatigue. Critical issues, quantification and practical implications. Advances in Experimental Medical Biology. 1995;384: 281–284. - PubMed
    1. Fuglevand AJ. Neural aspects of fatigue. Neuroscientist. 1996;2: 203–206.

MeSH terms