. 2017 Jun 2;12(6):e0177495.
doi: 10.1371/journal.pone.0177495. eCollection 2017.

Reconstruction of stented coronary arteries from optical coherence tomography images: Feasibility, validation, and repeatability of a segmentation method

Affiliations

Reconstruction of stented coronary arteries from optical coherence tomography images: Feasibility, validation, and repeatability of a segmentation method

Claudio Chiastra et al. PLoS One. .

Abstract

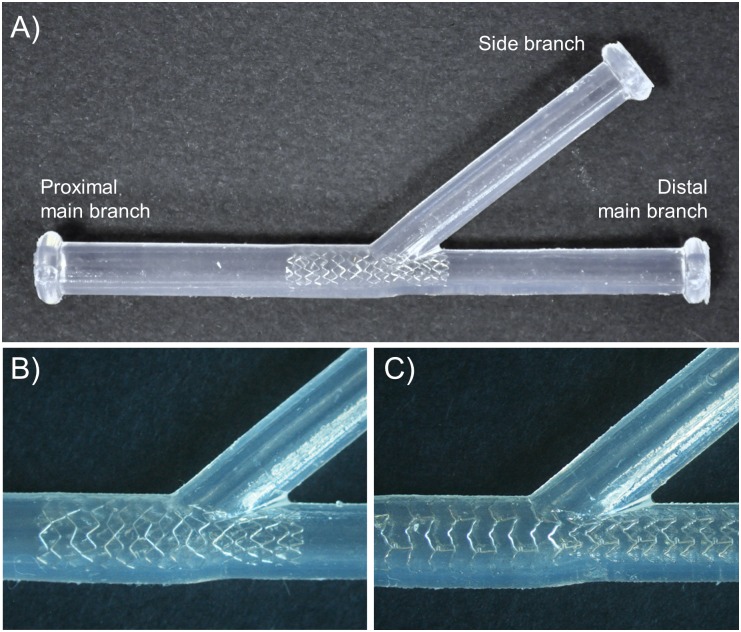
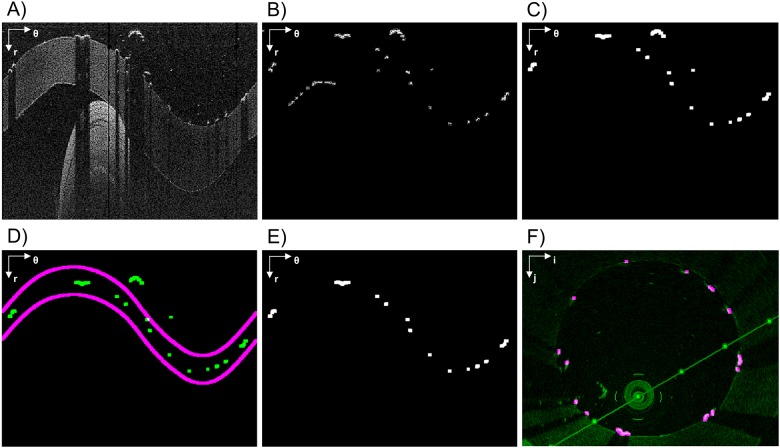
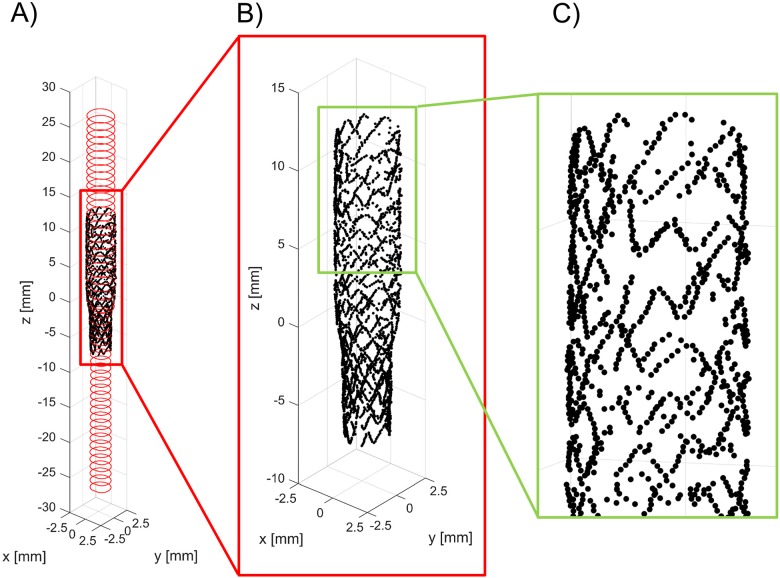
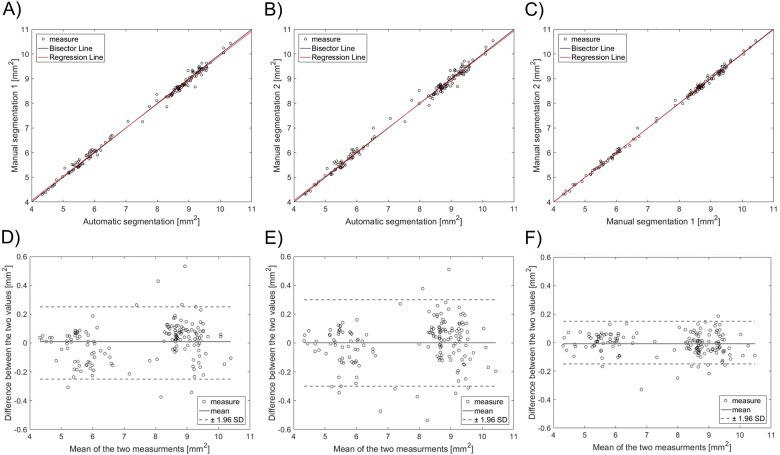
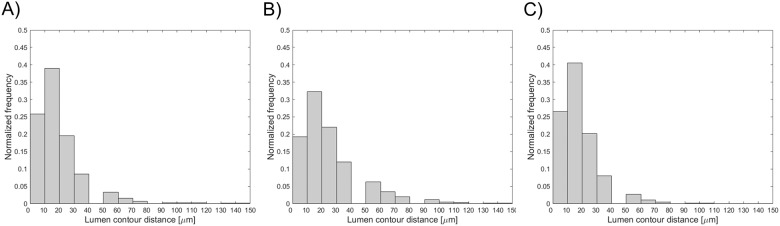
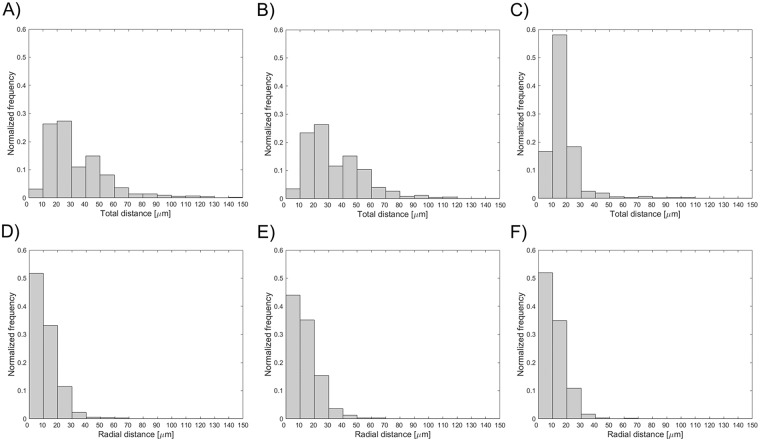
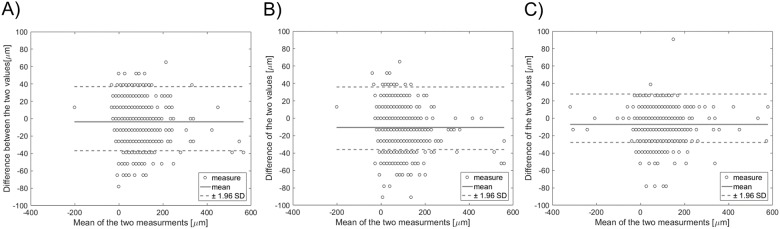
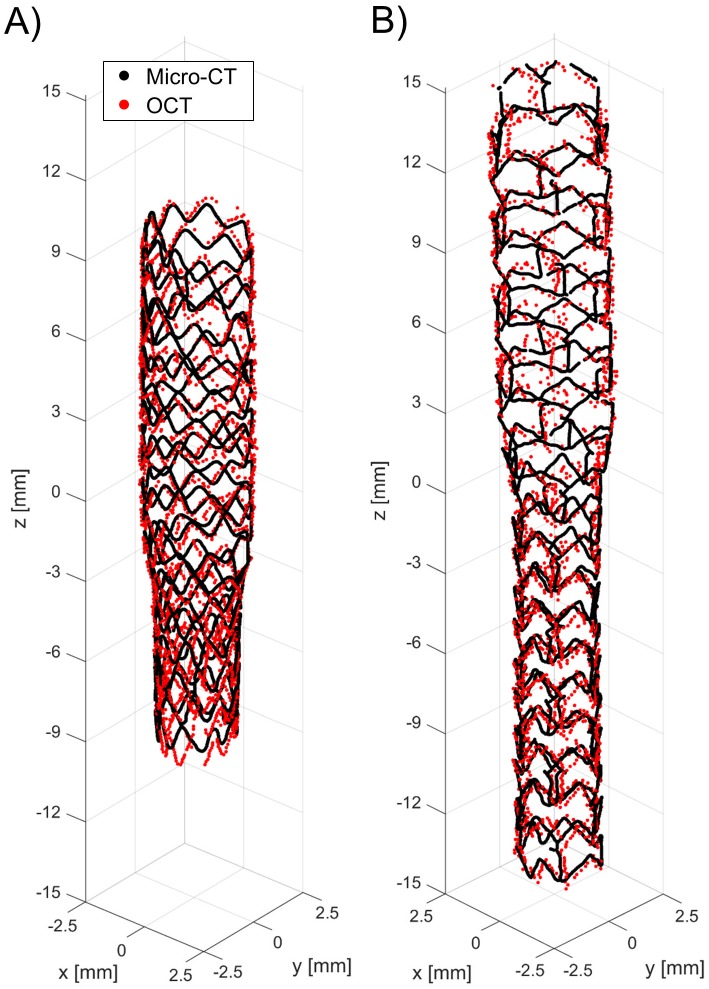
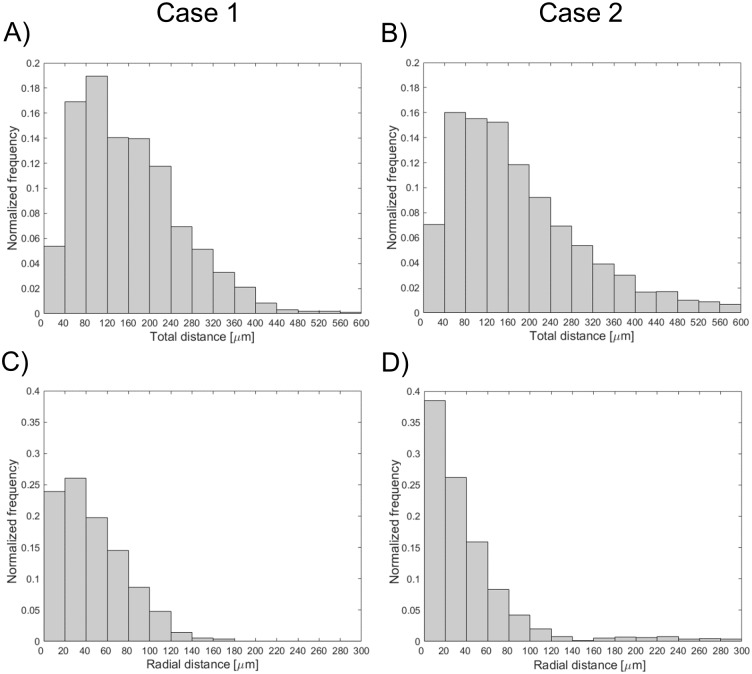
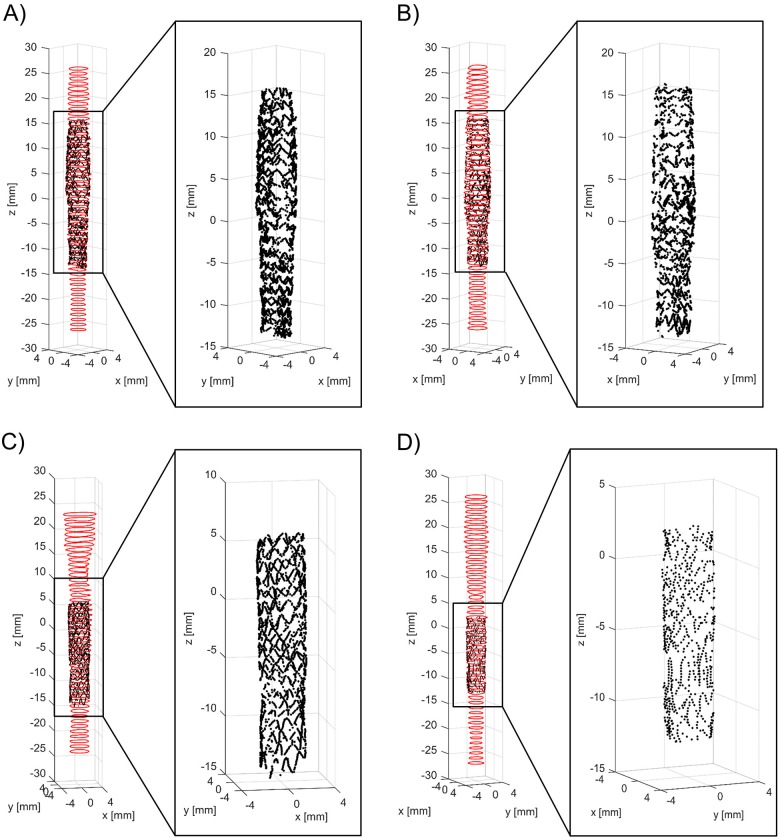
Optical coherence tomography (OCT) is an established catheter-based imaging modality for the assessment of coronary artery disease and the guidance of stent placement during percutaneous coronary intervention. Manual analysis of large OCT datasets for vessel contours or stent struts detection is time-consuming and unsuitable for real-time applications. In this study, a fully automatic method was developed for detection of both vessel contours and stent struts. The method was applied to in vitro OCT scans of eight stented silicone bifurcation phantoms for validation purposes. The proposed algorithm comprised four main steps, namely pre-processing, lumen border detection, stent strut detection, and three-dimensional point cloud creation. The algorithm was validated against manual segmentation performed by two independent image readers. Linear regression showed good agreement between automatic and manual segmentations in terms of lumen area (r>0.99). No statistically significant differences in the number of detected struts were found between the segmentations. Mean values of similarity indexes were >95% and >85% for the lumen and stent detection, respectively. Stent point clouds of two selected cases, obtained after OCT image processing, were compared to the centerline points of the corresponding stent reconstructions from micro computed tomography, used as ground-truth. Quantitative comparison between the corresponding stent points resulted in median values of ~150 μm and ~40 μm for the total and radial distances of both cases, respectively. The repeatability of the detection method was investigated by calculating the lumen volume and the mean number of detected struts per frame for seven repeated OCT scans of one selected case. Results showed low deviation of values from the median for both analyzed quantities. In conclusion, this study presents a robust automatic method for detection of lumen contours and stent struts from OCT as supported by focused validation against both manual segmentation and micro computed tomography and by good repeatability.


Conflict of interest statement

Competing Interests: The authors have declared that no competing interests exist.

Figures

Fig 1
Fig 1
Examples of stented coronary bifurcation phantoms: A) Bifurcation phantom with a bifurcation angle of 40° and a Resolute Integrity stent (Case 1). B) Detail of the Resolute Integrity stent implanted in a 40° bifurcation phantom (Case 1). C) Detail of the Xience Prime stent implanted in a 40° bifurcation phantom (Case 2).
Fig 2
Fig 2
Pre-processing steps: A) Original RGB OCT image. B) Greyscale image. C) Image after crop of the lower part, which represents the longitudinal view of the vessel phantom. D) Image without visualization tools and catheter.
Fig 3
Fig 3
Lumen contour detection steps. A) Pre-processed image (in polar coordinates). The red line highlights an example of A-scan. B) Image without background noise. C) Raw lumen contour detection. D) Detected lumen contour (green) and validity region of the segmentation (purple). E) Lumen contour without misdetections. F) Lumen contour (blue) detected after gaps closing, smoothing, and conversion back to Cartesian coordinates. The polar coordinate system (r; θ) or the Cartesian coordinate system (i; j) is indicated on the top left of each image.
Fig 4
Fig 4
Example of stent strut detection. A) Two A-scans are analyzed. The first one passes through a stent strut while the second one passes only through the vessel wall. The polar coordinate system (r; θ) is indicated on the top left. B) Corresponding intensity profiles of A-scans 1 and 2. The strut is detected because of the higher slope of the intensity profile of its A-scan.
Fig 5
Fig 5
Stent struts detection algorithm steps. A) Pre-processed image (in polar coordinates). B) Rough detection. C) Result of the application of the triangular shaped window followed by an intensity thresholding. D) Detected struts (green) and the validity region of the segmentation (purple). E) Image without errors. F) Detected struts (purple) overlapped to the original image (green) in Cartesian coordinates. The polar coordinate system (r; θ) or the Cartesian coordinate system (i; j) is indicated on the top left of each image.
Fig 6
Fig 6
A) Three-dimensional point cloud of the main branch of a bifurcation phantom with an implanted Resolute Integrity stent (case 1) obtained with the lumen border and stent struts detection algorithms. B, C) Details of the stent point cloud.
Fig 7
Fig 7
Top—Linear regression plots of the lumen area of 160 randomly selected OCT images: A) automatic segmentation against manual segmentation by image reader 1 (R1); B) automatic segmentation against manual segmentation by image reader 2 (R2); C) manual segmentation by R1 against that by R2. Bottom—Bland-Altman plots of the lumen area: D) automatic segmentation against R1; E) automatic segmentation against R2; F) manual segmentation by R1 against R2.
Fig 8
Fig 8
Distribution of the distance between the lumen contours obtained on 160 randomly selected OCT images with (A) the automatic algorithm and manual segmentation by image reader 1, (B) the automatic algorithm and manual segmentation by image reader 2, and (C) the two manual segmentations.
Fig 9
Fig 9
Distributions of the total (top) and radial (bottom) distances between the centroid of each segmented strut (A, D) by the automatic algorithm and the nearest manually identified strut by image reader 1, (B, E) by the automatic algorithm and the nearest manually identified strut by image reader 2, and (C, F) by the two manual segmentations.
Fig 10
Fig 10
Bland-Altman diagrams of length of apposition (LOA): A) automatic segmentation against R1; B) automatic segmentation against R2; C) manual segmentation by R1 against R2.
Fig 11
Fig 11
Superimposition of the stent point clouds obtained through the automatic detection algorithm (red) and micro-CT (black): A) Case 1 (Resolute Integrity 3x18 mm). B) Case 2 (Xience Prime 3x28 mm).
Fig 12
Fig 12
Distributions of the total (top) and radial (bottom) distances between corresponding points of the stents: A, C) Case 1 (Resolute Integrity 3x18 mm). B, D) Case 2 (Xience Prime 3x28 mm).
Fig 13
Fig 13
Three-dimensional lumen and stent point clouds of the four patient-specific stented coronary segments under investigation, which were obtained by applying the developed lumen border and stent struts detection algorithms: A) distal right coronary artery segment treated with Xience Prime 3.5x28 mm; B) mid right coronary artery segment treated with Xience Prime 3.5x28 mm; C) left anterior descending coronary artery segment treated with Resolute Integrity 3.5x18 mm; D) left anterior descending coronary artery segment treated with Resolute Integrity 2.75x14 mm. For each case, details of the stent point cloud are provided.

References

    1. Bezerra HG, Attizzani GF, Sirbu V, Musumeci G, Lortkipanidze N, Fujino Y, et al. Optical coherence tomography versus intravascular ultrasound to evaluate coronary artery disease and percutaneous coronary intervention. JACC Cardiovasc Interv. 2013;6: 228–236. 10.1016/j.jcin.2012.09.017 - DOI - PubMed
    1. Magnus PC, Jayne JE, Garcia-Garcia HM, Swart M, Van Es GA, Tijssen J, et al. Optical coherence tomography versus intravascular ultrasound in the evaluation of observer variability and reliability in the assessment of stent deployment: The OCTIVUS study. John Wiley and Sons Inc.; 2015;86: 229–235. 10.1002/ccd.25854 - DOI - PubMed
    1. Ughi GJ, Adriaenssens T. Advances in Automated Assessment of Intracoronary Optical Coherence Tomography and Their Clinical Application. Elsevier Inc.; 2015. pp. 351–360. 10.1016/j.iccl.2015.02.004 - DOI - PubMed
    1. Ferrante G, Presbitero P, Whitbourn R, Barlis P. Current applications of optical coherence tomography for coronary intervention. Int J Cardiol. Elsevier Ireland Ltd; 2013;165: 7–16. 10.1016/j.ijcard.2012.02.013 - DOI - PubMed
    1. Nammas W, Ligthart JMR, Karanasos A, Witberg KT, Regar E. Optical coherence tomography for evaluation of coronary stents in vivo. 2013. pp. 577–588. 10.1586/erc.13.37 - DOI - PubMed

Publication types