. 2017 Jun 2;12(6):e0178376.
doi: 10.1371/journal.pone.0178376. eCollection 2017.

Plasma metabolome and skin proteins in Charcot-Marie-Tooth 1A patients

Affiliations

Plasma metabolome and skin proteins in Charcot-Marie-Tooth 1A patients

Beatriz Soldevilla et al. PLoS One. .

Abstract

Objective: Charcot-Marie-Tooth 1A (CMT1A) disease is the most common inherited neuropathy that lacks of therapy and of molecular markers to assess disease severity. Herein, we have pursued the identification of potential biomarkers in plasma samples and skin biopsies that could define the phenotype of CMT1A patients at mild (Mi), moderate (Mo) and severe (Se) stages of disease as assessed by the CMT neuropathy score to contribute to the understanding of CMT pathophysiology and eventually inform of the severity of the disease.

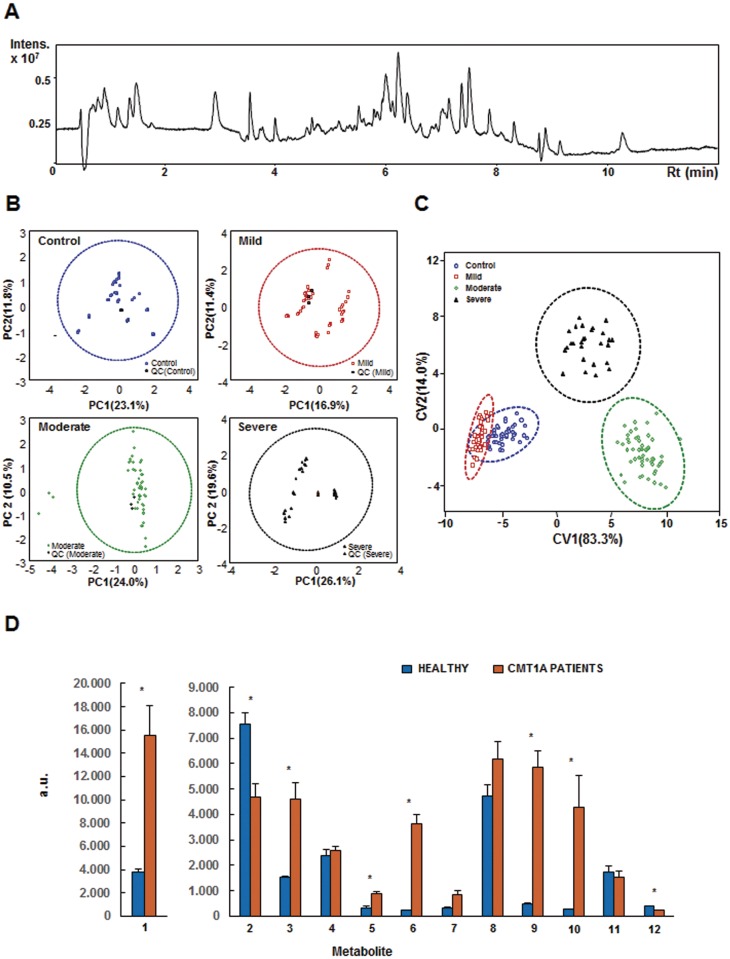
Methods: We have used: (i) a high-throughput untargeted metabolomic approach of plasma samples in a cohort of 42 CMT1A patients and 15 healthy controls (CRL) using ultrahigh liquid chromatography coupled to mass spectrometry and (ii) reverse phase protein microarrays to quantitate the expression of some proteins of energy metabolism and of the antioxidant response in skin biopsies of a cohort of 70 CMT1A patients and 13 healthy controls.

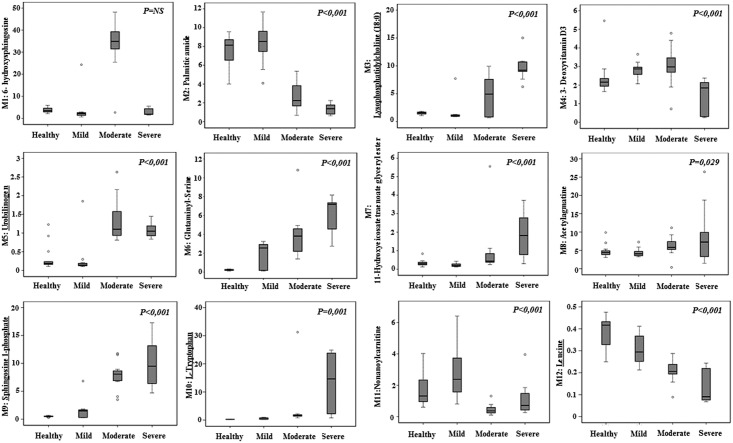
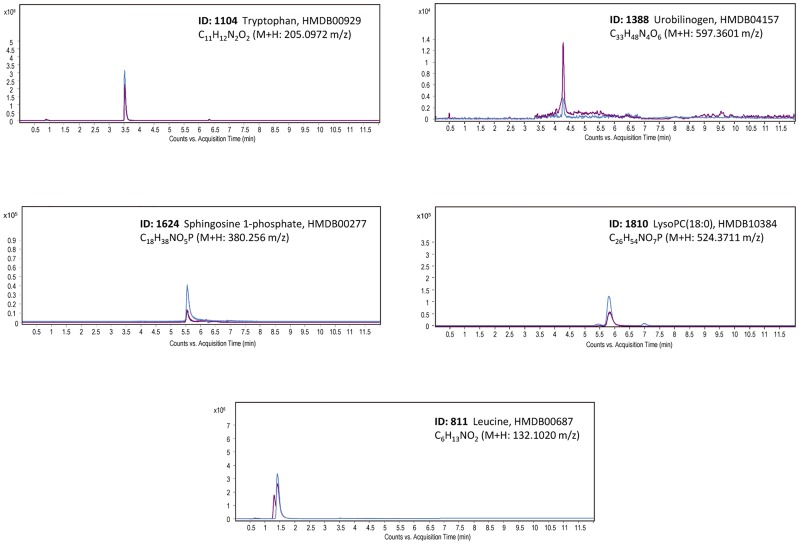
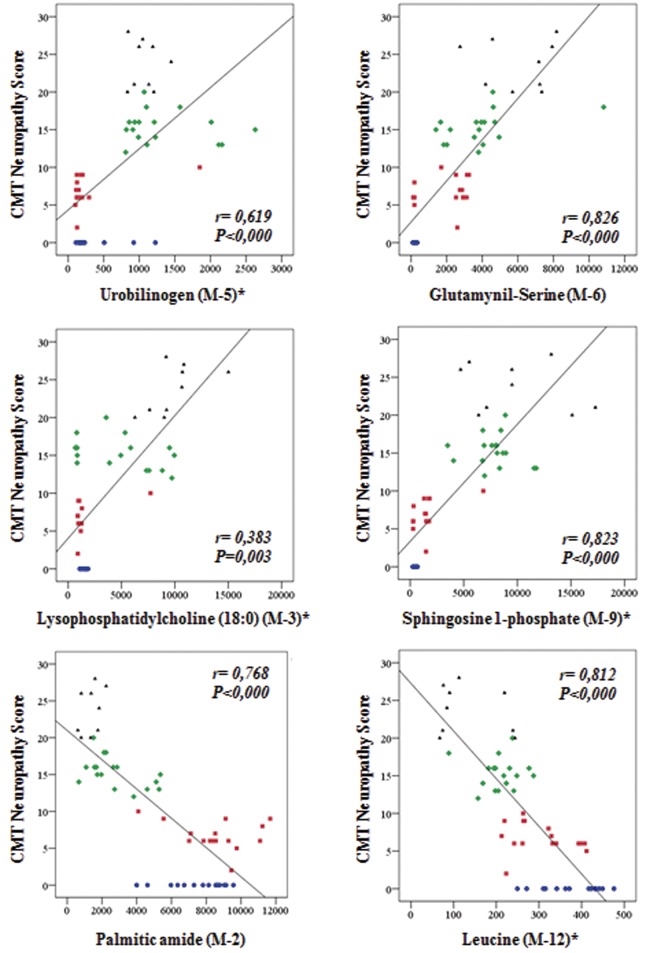
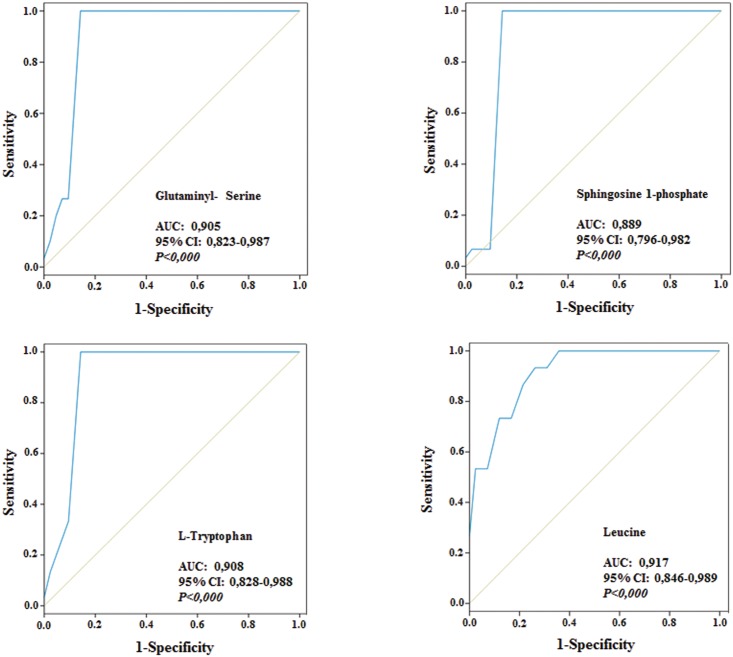
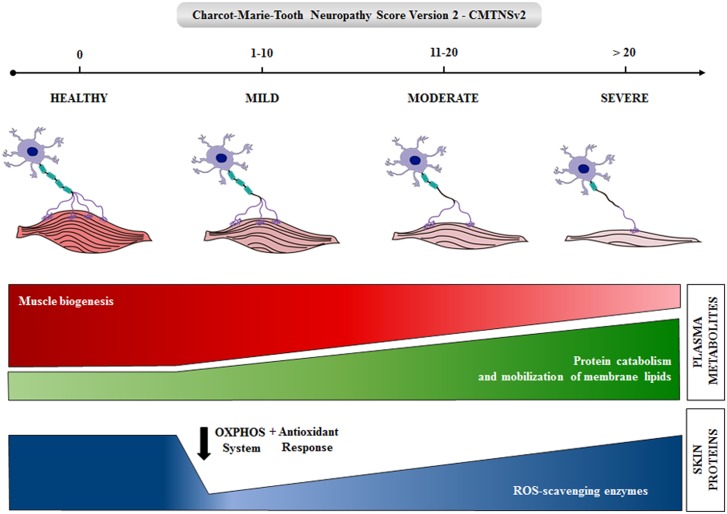
Results: The metabolomic approach identified 194 metabolites with significant differences among the four groups (Mi, Mo, Se, CRL) of samples. A multivariate Linear Discriminant Analysis model using 12 metabolites afforded the correct classification of the samples. These metabolites indicate an increase in protein catabolism and the mobilization of membrane lipids involved in signaling inflammation with severity of CMT1A. A concurrent depletion of leucine, which is required for the biogenesis of the muscle, is also observed in the patients. Protein expression in skin biopsies indicates early loss of mitochondrial and antioxidant proteins in patients' biopsies.

Conclusion: The findings indicate that CMT1A disease is associated with a metabolic state resembling inflammation and sarcopenia suggesting that it might represent a potential target to prevent the nerve and muscle wasting phenotype in these patients. The observed changes in metabolites could be useful as potential biomarkers of CMT1A disease after appropriate validation in future longitudinal studies.


Conflict of interest statement

Competing Interests: The authors have declared that no competing interests exist.

Figures

Fig 1
Fig 1. Analysis of plasma metabolome in CMT1A patients.
(A), Representative UHPLC-MS total ion chromatogram of plasma samples. (B), Plot in a two-dimensional Cartesian coordinate system, with the axes (principal components, PC) representing the greatest variations in the data of Control (blue), Mild (red), Moderate (green) and Severe (black) states related to CMT1A. Three quality control (QC) injections per group are also represented in the plot for the four groups of individuals. 95% confidence ellipses are also included. Triplicate outliers of one of the samples in the Moderate group fall out of the ellipse. (C), Plot of distribution of the plasma samples defined by the two canonical variables (CV1 and CV2) obtained by Canonical Variate Analysis considering the 12 selected metabolites after forward stepwise Linear Discriminant Analysis. The 95% canonical ellipses are also included. Control subjects and mild, moderate and severe CMT1A patients are represented by blue circles, red squares, green diamonds and black triangles, respectively. (D), Histogram showing the content of the 12 metabolites in plasma samples of healthy (blue, n = 15) and CMT1A patients (yellow, n = 42). The results shown are the mean values ± S.E.M. *, P<0.05 by Student’s t test.
Fig 2
Fig 2. Whisker plots showing significant correlations between plasma metabolite levels and severity of the disease in CMT1A patients.
Determination of the plasma levels of the 12 selected metabolites after forward stepwise Linear Discriminant Analysis was carried out by UHPLC-MS and grouped considering severity of the disease as assessed by the CMT neuropathy score (second version). Healthy subjects (n = 15), Mild (n = 15), Moderate (n = 18) and Severe (n = 9) groups of CMT1A patients are represented. Identification of the metabolites was achieved by matching the obtained accurate m/z to those published in appropriated databases (see S2 Table) and when available, by co-elution of commercial standards with the extracted ion chromatograms of plasma samples (highlighted in red). Box plots represent the lowest, lower quartile, median, upper quartile, and highest observations of each marker in the different groups. ○, outlier values P-value is calculated by analysis of variance; r is the Spearman coefficient.
Fig 3
Fig 3. Identification of metabolites by co-elution with commercial standards.
Extracted ion chromatograms of selected metabolites in plasma samples (purple lines) and commercial standards (blue lines) are shown. The metabolites are defined by their name, ID number, m/z (M+H), retention time, Human Metabolome Data Base ID number and molecular formula.
Fig 4
Fig 4. Scatter plots showing significant correlations between plasma metabolite levels and severity of the disease in CMT1A patients.
Determination of the plasma levels of the metabolites was carried out by UHPLC-MS and its levels correlated with severity of the disease as assessed by CMTNSv2. Healthy controls (blue circles, n = 15), Mild (red squares, n = 15), Moderate (green diamonds, n = 18) and Severe (black triangles, n = 9) groups of CMT1A patients are represented. Metabolites related to (i) protein catabolism (upper row); (ii) mobilization of membrane lipids (middle row) and (iii) muscle biogenesis and the anti-apoptotic function (lower row) are represented. P-value is calculated by analysis of variance; r is the Spearman coefficient.
Fig 5
Fig 5. Diagnostic performance of metabolic biomarkers.
ROC curves were plotted to describe performance characteristics of the indicated metabolites in the 57 subject cohort. The Area under the curve (AUC), 95% range of the interval of confidence (IC) and P values are indicated.
Fig 6
Fig 6. Summary of the major changes in the expression of skin and plasma metabolites during progression of CMT1A.
The loss of muscle and nerves is shown during severity of the disease as revealed by the CMT neuropathy score v2. The changes in biomarkers are illustrated by row thicknesses.

Similar articles

Cited by

References

    1. Martyn CN, Hughes RA. Epidemiology of peripheral neuropathy. J Neurol Neurosurg Psychiatry. 1997;62(4):310–318. - PMC - PubMed
    1. Pareyson D, Marchesi C. Diagnosis, natural history, and management of Charcot-Marie-Tooth disease. Lancet Neurol. 2009;8(7):654–667. 10.1016/S1474-4422(09)70110-3 . - DOI - PubMed
    1. Lupski JR, de Oca-Luna RM, Slaugenhaupt S, Pentao L, Guzzetta V, Trask BJ, et al. DNA duplication associated with Charcot-Marie-Tooth disease type 1A. Cell. 1991;66(2):219–232. . - PubMed
    1. Raeymaekers P, Timmerman V, Nelis E, De Jonghe P, Hoogendijk JE, Baas F, et al. Duplication in chromosome 17p11.2 in Charcot-Marie-Tooth neuropathy type 1a (CMT 1a). The HMSN Collaborative Research Group. Neuromuscul Disord. 1991;1(2):93–97. . - PubMed
    1. Saporta AS, Sottile SL, Miller LJ, Feely SM, Siskind CE, Shy ME. Charcot-Marie-Tooth disease subtypes and genetic testing strategies. Ann Neurol. 2011;69(1):22–33. 10.1002/ana.22166 - DOI - PMC - PubMed